Extracting conceptual shifts from analysis of visualmotor data
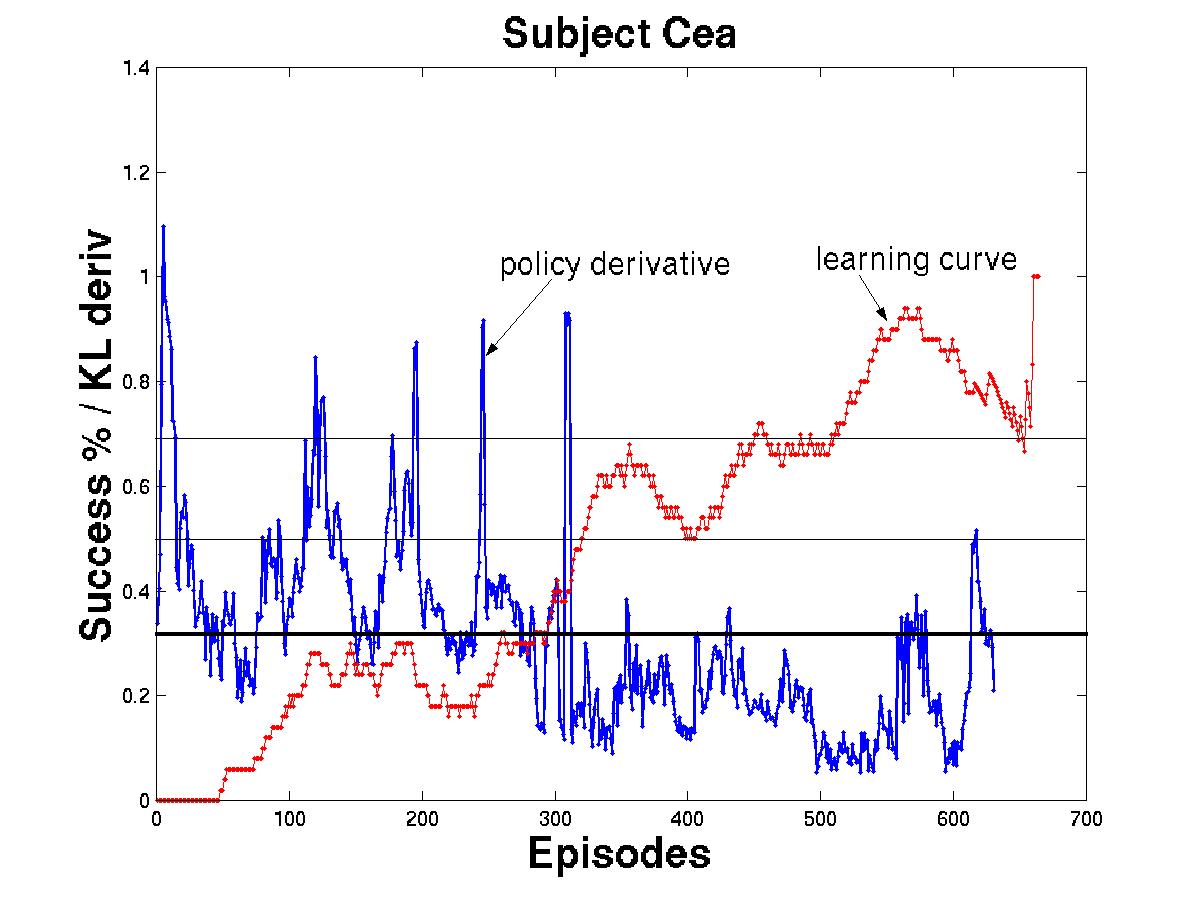
Successful subjects have 3-5 "aha" moments in the first half of the
training period when they acquire the NRL task. These are indicated by
the blue peaks in the graph below which correspond to times when
subject radically changes his strategy. These peaks are tightly correlated
with performance improvement as indicated by the red learning curve.
The second half of training consists of implementing the learned strategy
in the visualmotor system, which is why performance continues to improve
without any significant change in the underlying strategy.