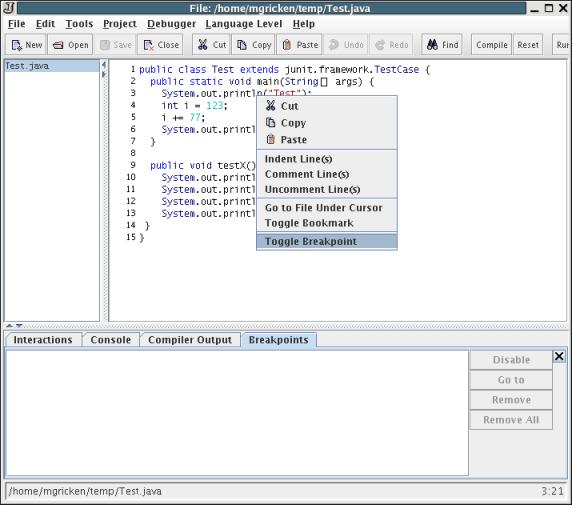
To use the debugger, you must first set a breakpoint on the line(s) of code on which you want execution to stop. To do this, right click on the line of code that you want the breakpoint on and select Toggle Breakpoint from the menu.
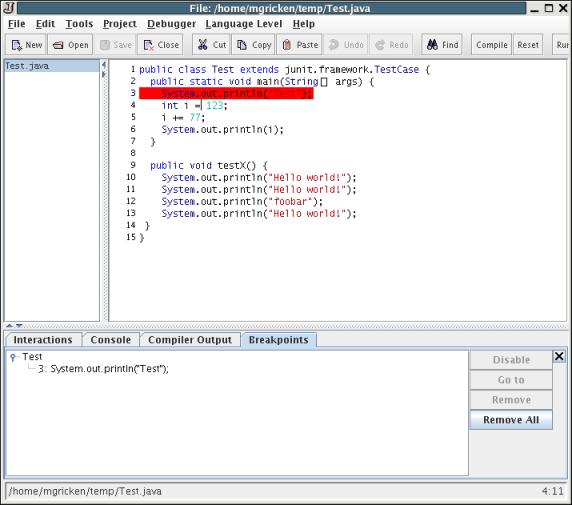
Once a breakpoint is set, it is highlighted in red, like this:
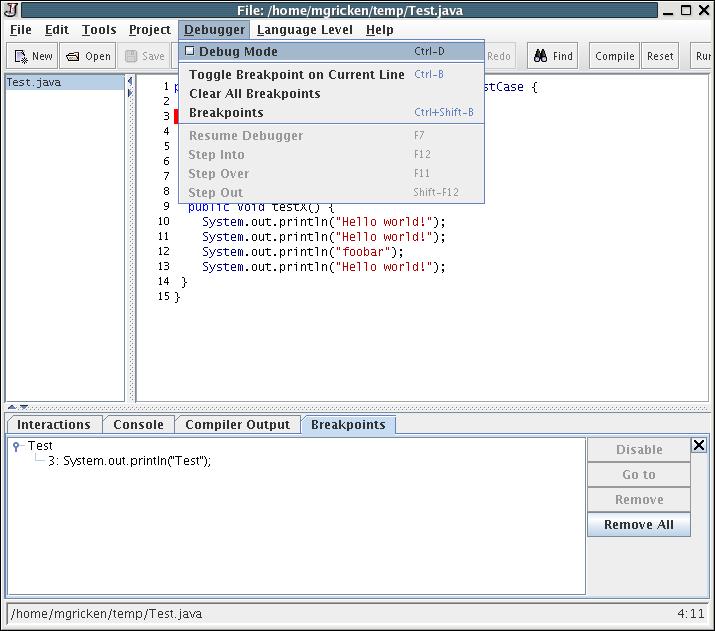
Once you have set the breakpoint(s), enable the debugger by pressing Ctrl+D or invoking the "Debug Mode" command of the Debugger menu.
Now enter a statement in the Interactions Pane that will run the method containing the breakpoint(s). Once execution reaches a breakpoint, it will halt, awaiting input from you.
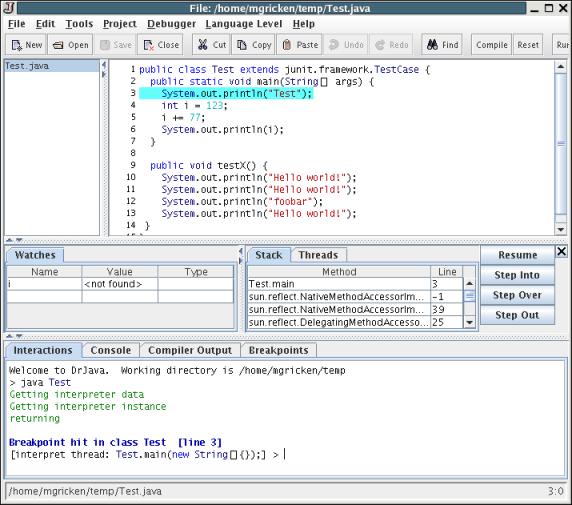
At this point, the line that is about to be executed is highlighted in a special color (light blue by default), the "resume", "step into", "step over", and "step out" buttons are enabled, and a special prompt appears in the Interactions Pane.
The Resume Button: runs the program until another breakpoint is reached, or the interaction has ended.
The Step Into Button: steps through the execution of the method invocations in the current line.
The Step Over Button: executes the current line and stops execution on the next line.
The Step Out Button: executes the rest of the current method and stops execution at the line from which the current method was called.
At the prompt, you can still type arbitrary Java expressions like usual, but you have additional power--all the fields, variables, methods, and classes than can be seen from the current point in the execution can be viewed and modified. This gives you incredible power--you can actually modify the values of your fields and variables while debugging. All you have to do is type in an assignment statement.