hprof_trace.c File Reference
#include "hprof.h"
Go to the source code of this file.
Data Structures | |
| struct | TraceKey |
| struct | TraceInfo |
| struct | IterateInfo |
Functions | |
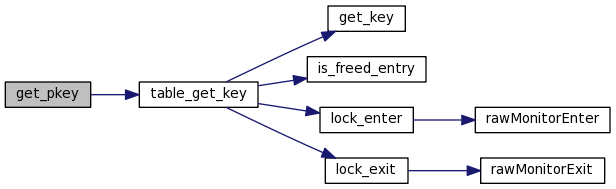
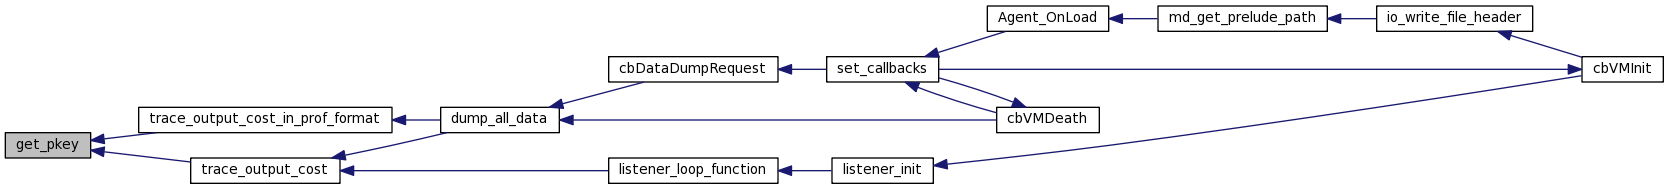
| static TraceKey * | get_pkey (TraceIndex index) |
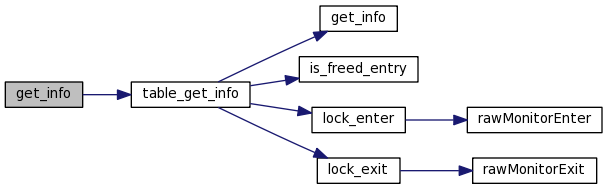
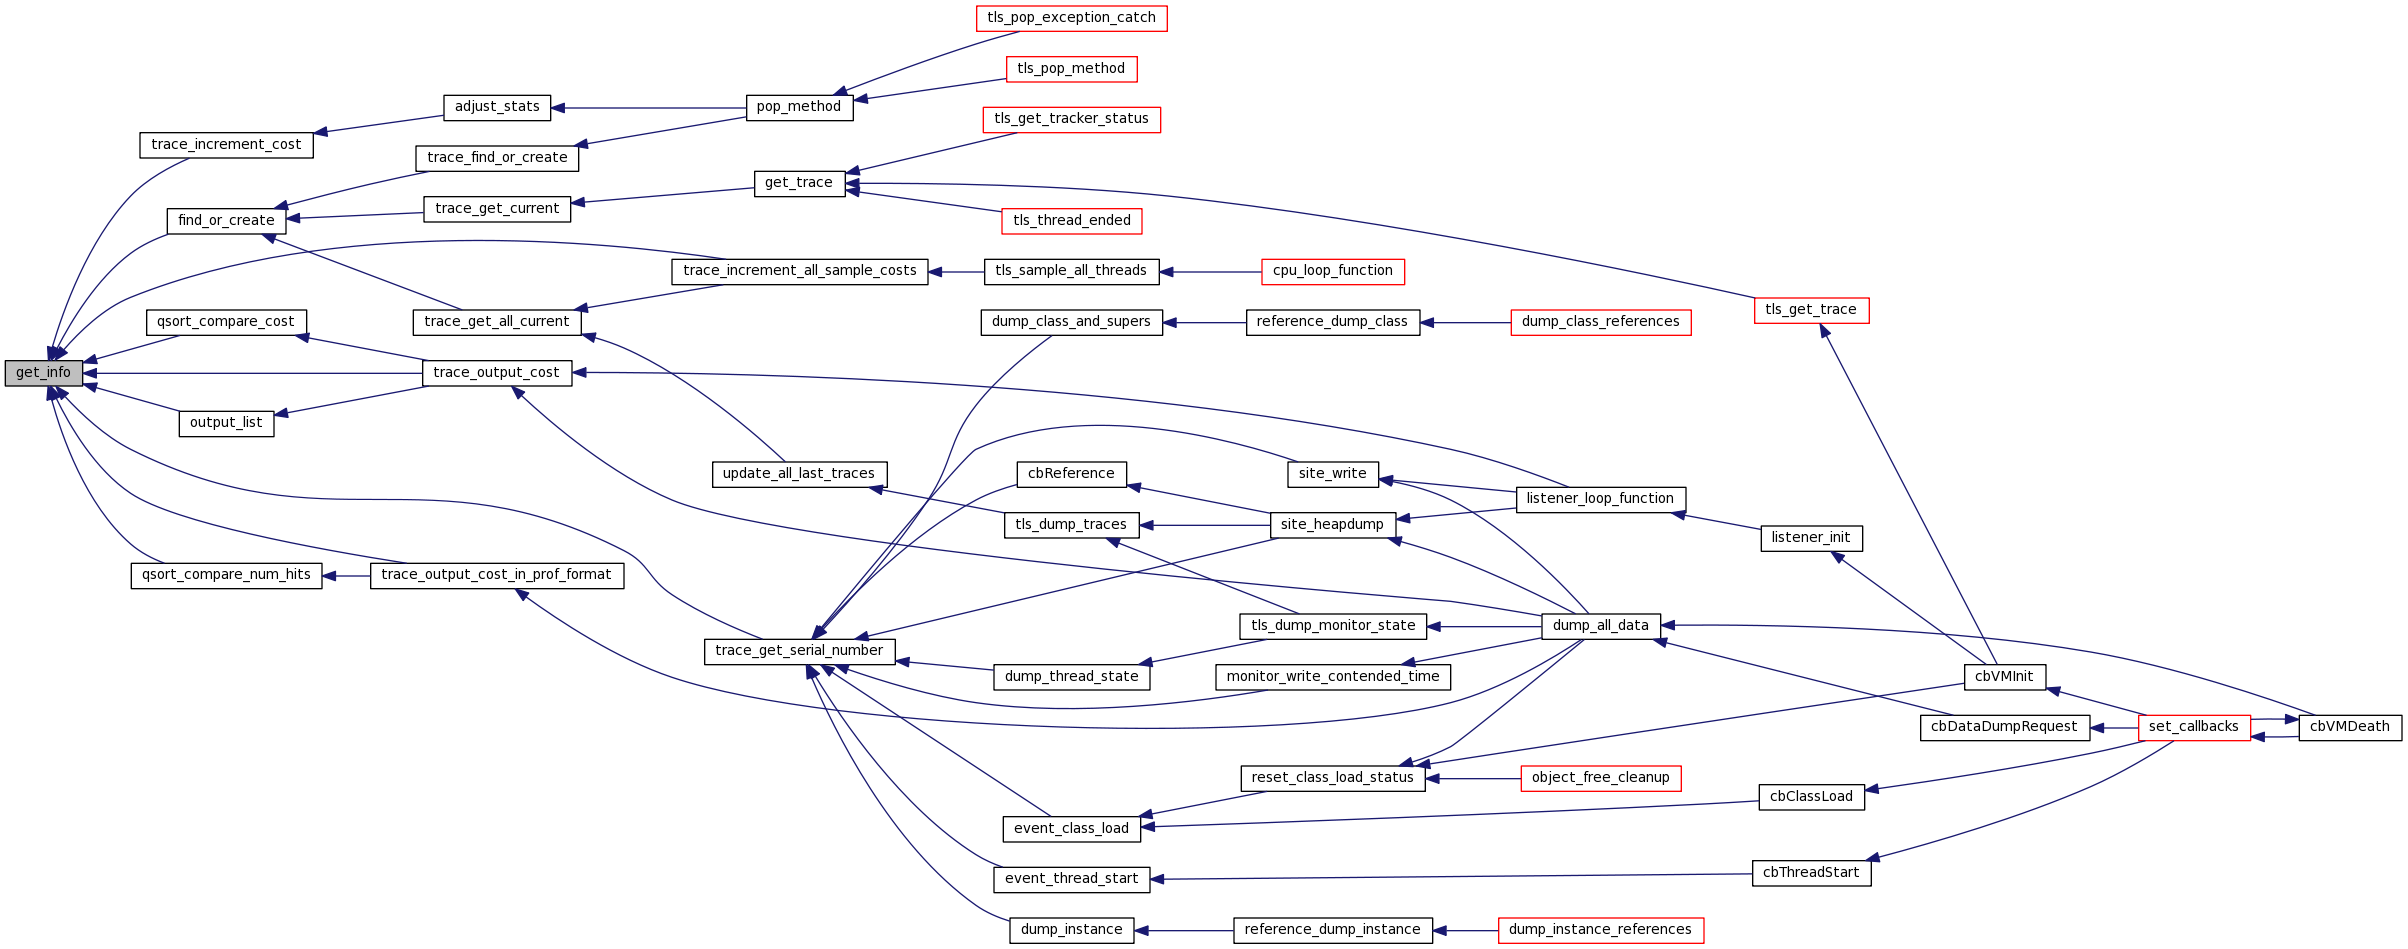
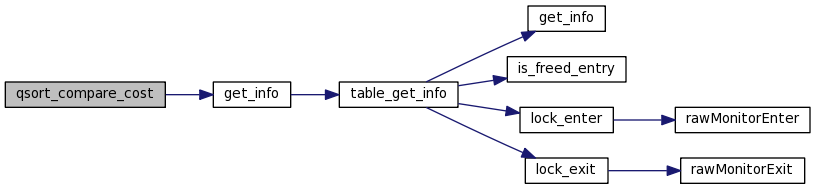
| static TraceInfo * | get_info (TraceIndex index) |
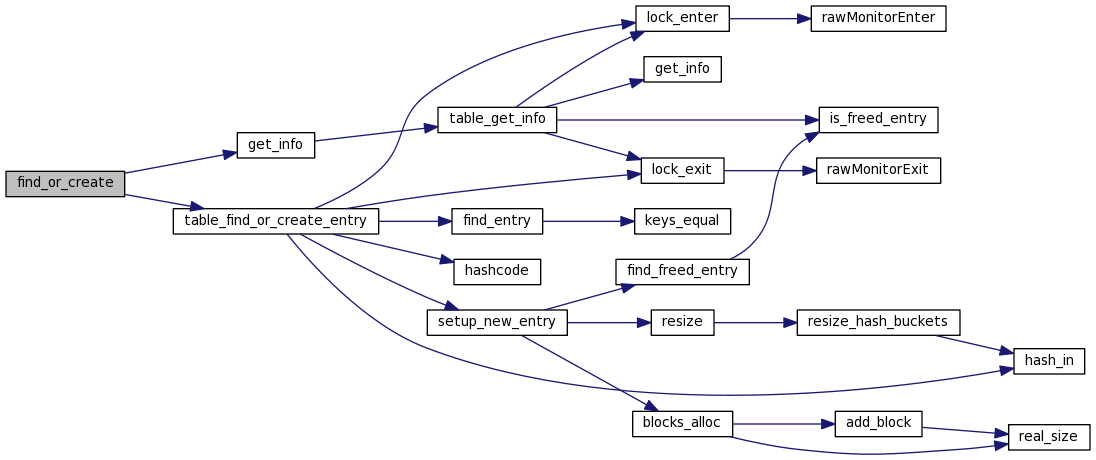
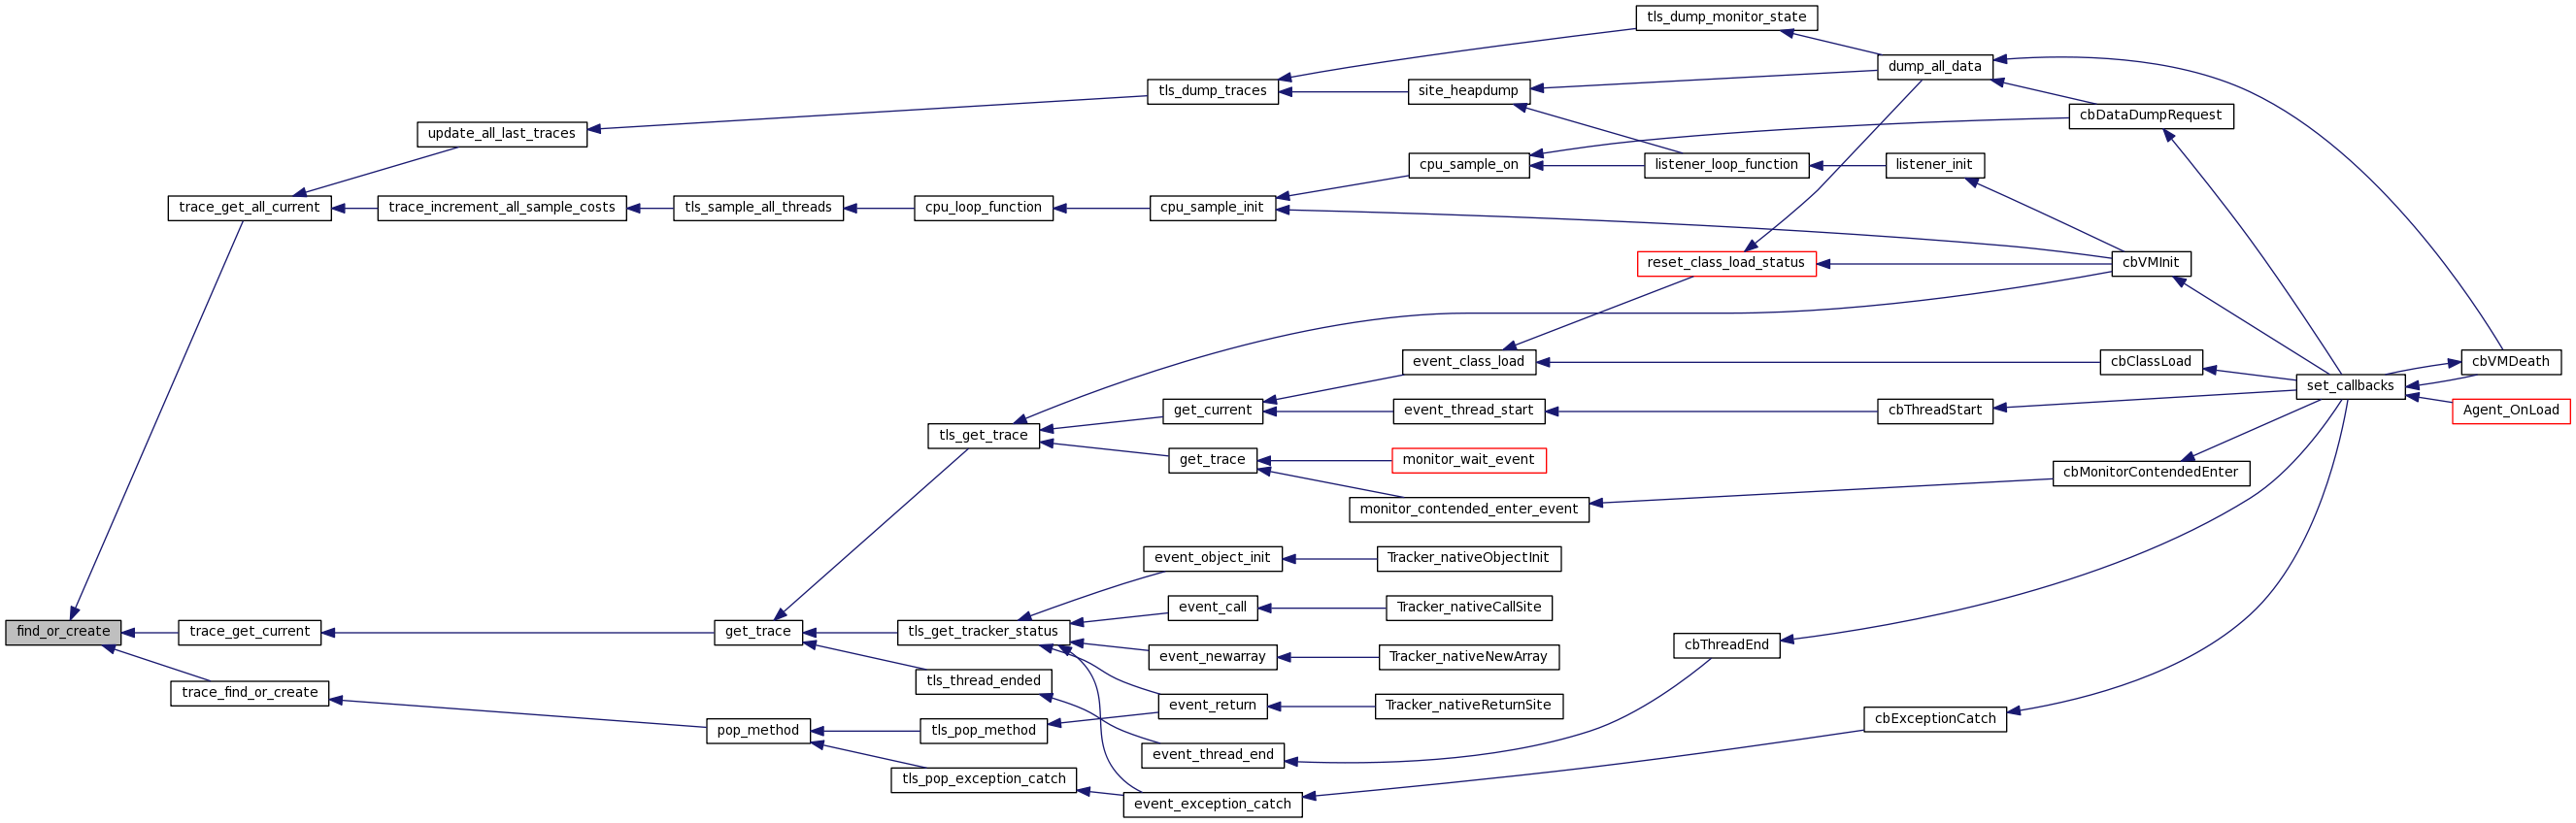
| static TraceIndex | find_or_create (SerialNumber thread_serial_num, jint n_frames, FrameIndex *frames, jvmtiPhase phase, TraceKey *trace_key_buffer) |
| static void | list_item (TableIndex index, void *key_ptr, int key_len, void *info_ptr, void *arg) |
| static void | clear_cost (TableIndex i, void *key_ptr, int key_len, void *info_ptr, void *arg) |
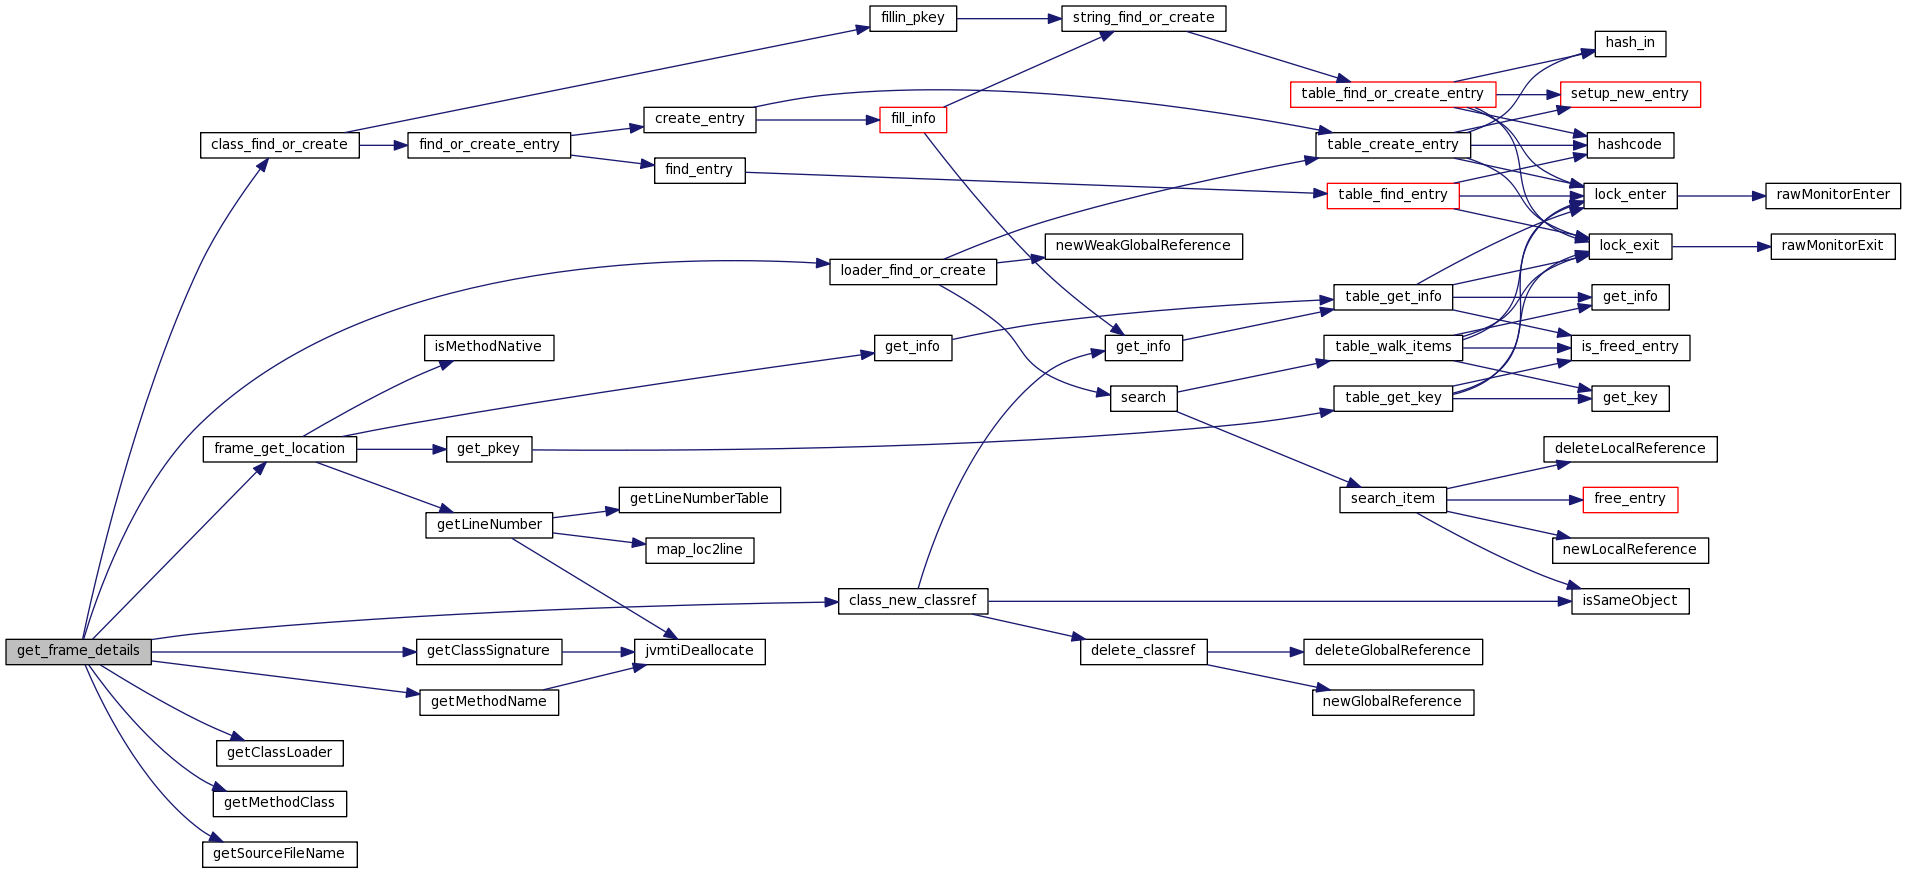
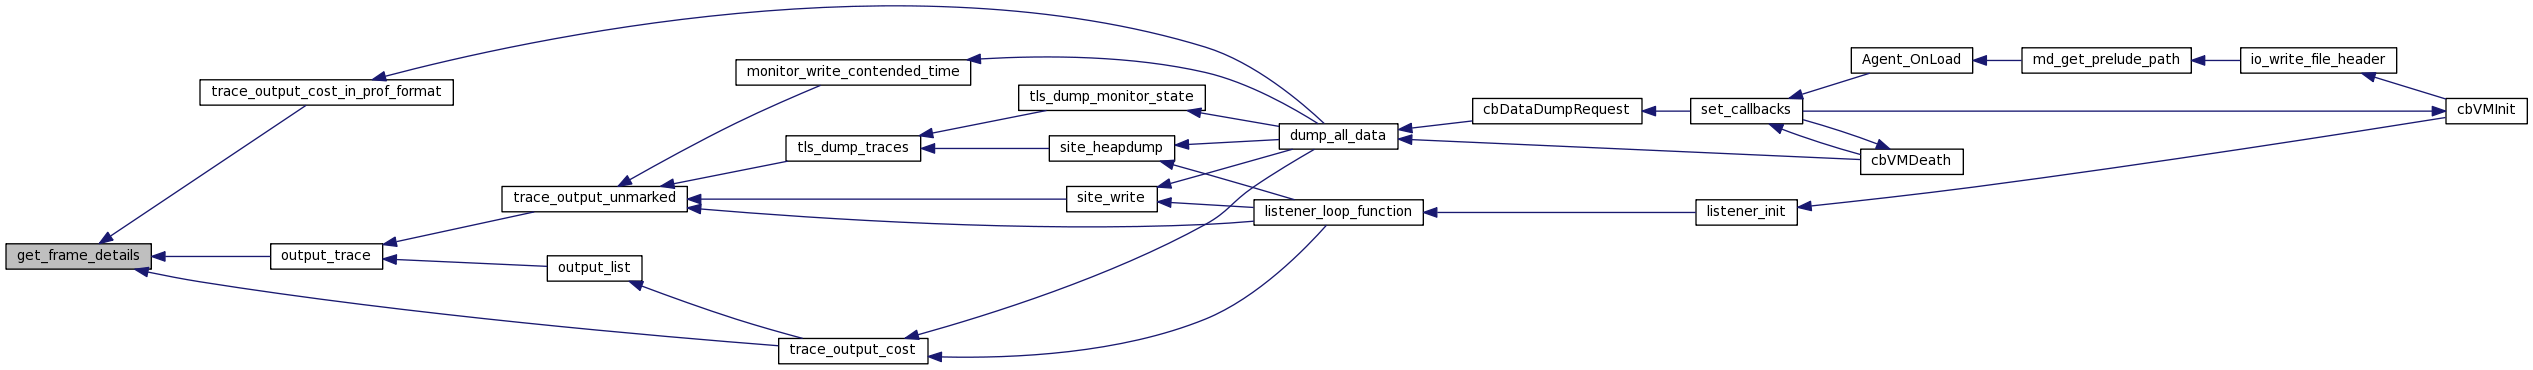
| static void | get_frame_details (JNIEnv *env, FrameIndex frame_index, SerialNumber *frame_serial_num, char **pcsig, ClassIndex *pcnum, char **pmname, char **pmsig, char **psname, jint *plineno) |
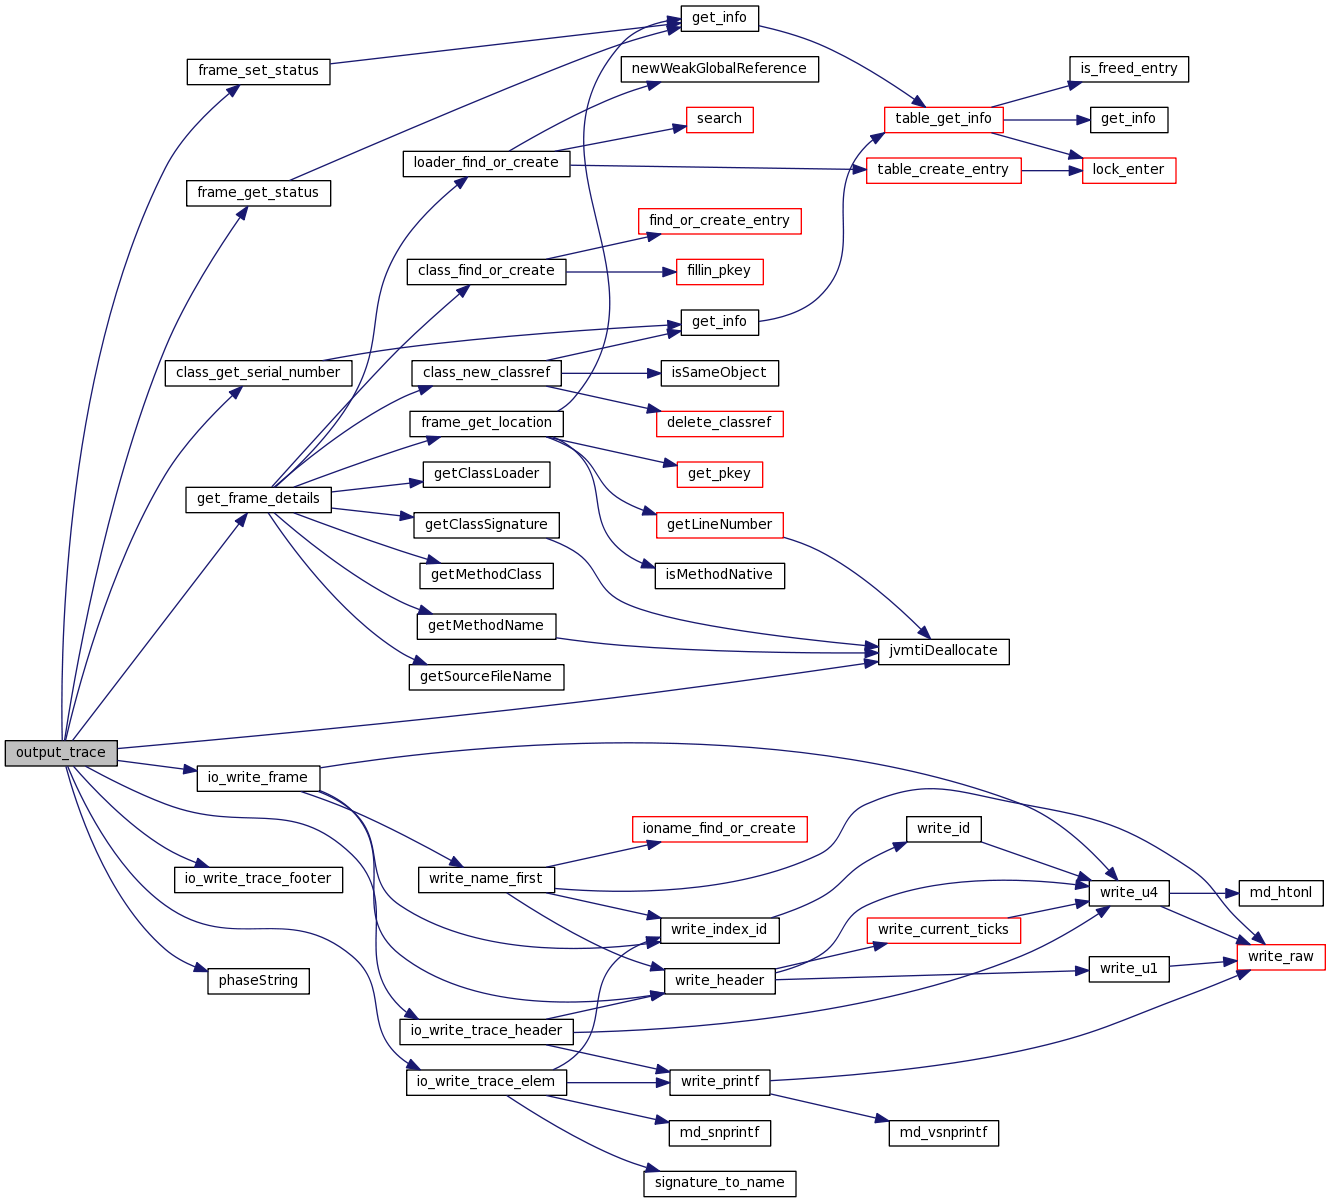
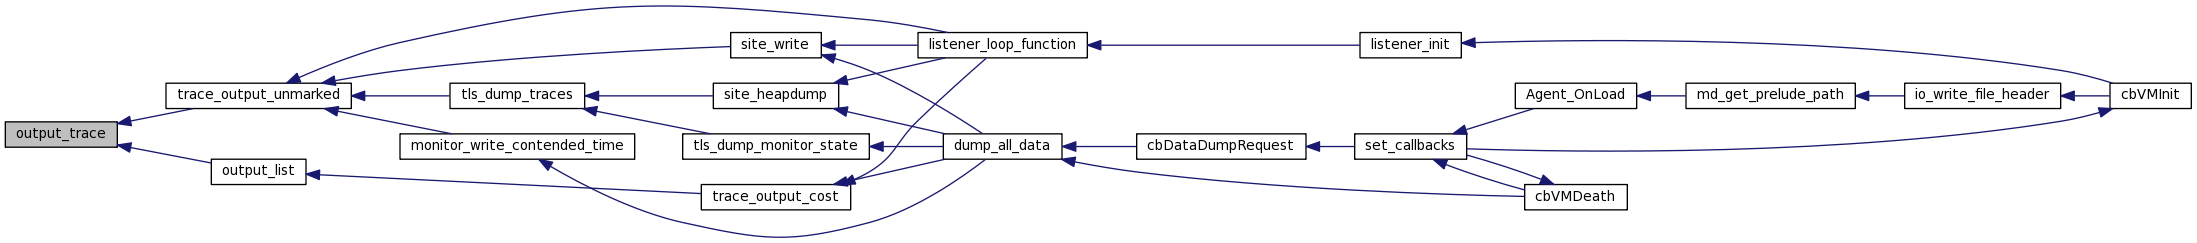
| static void | output_trace (TableIndex index, void *key_ptr, int key_len, void *info_ptr, void *arg) |
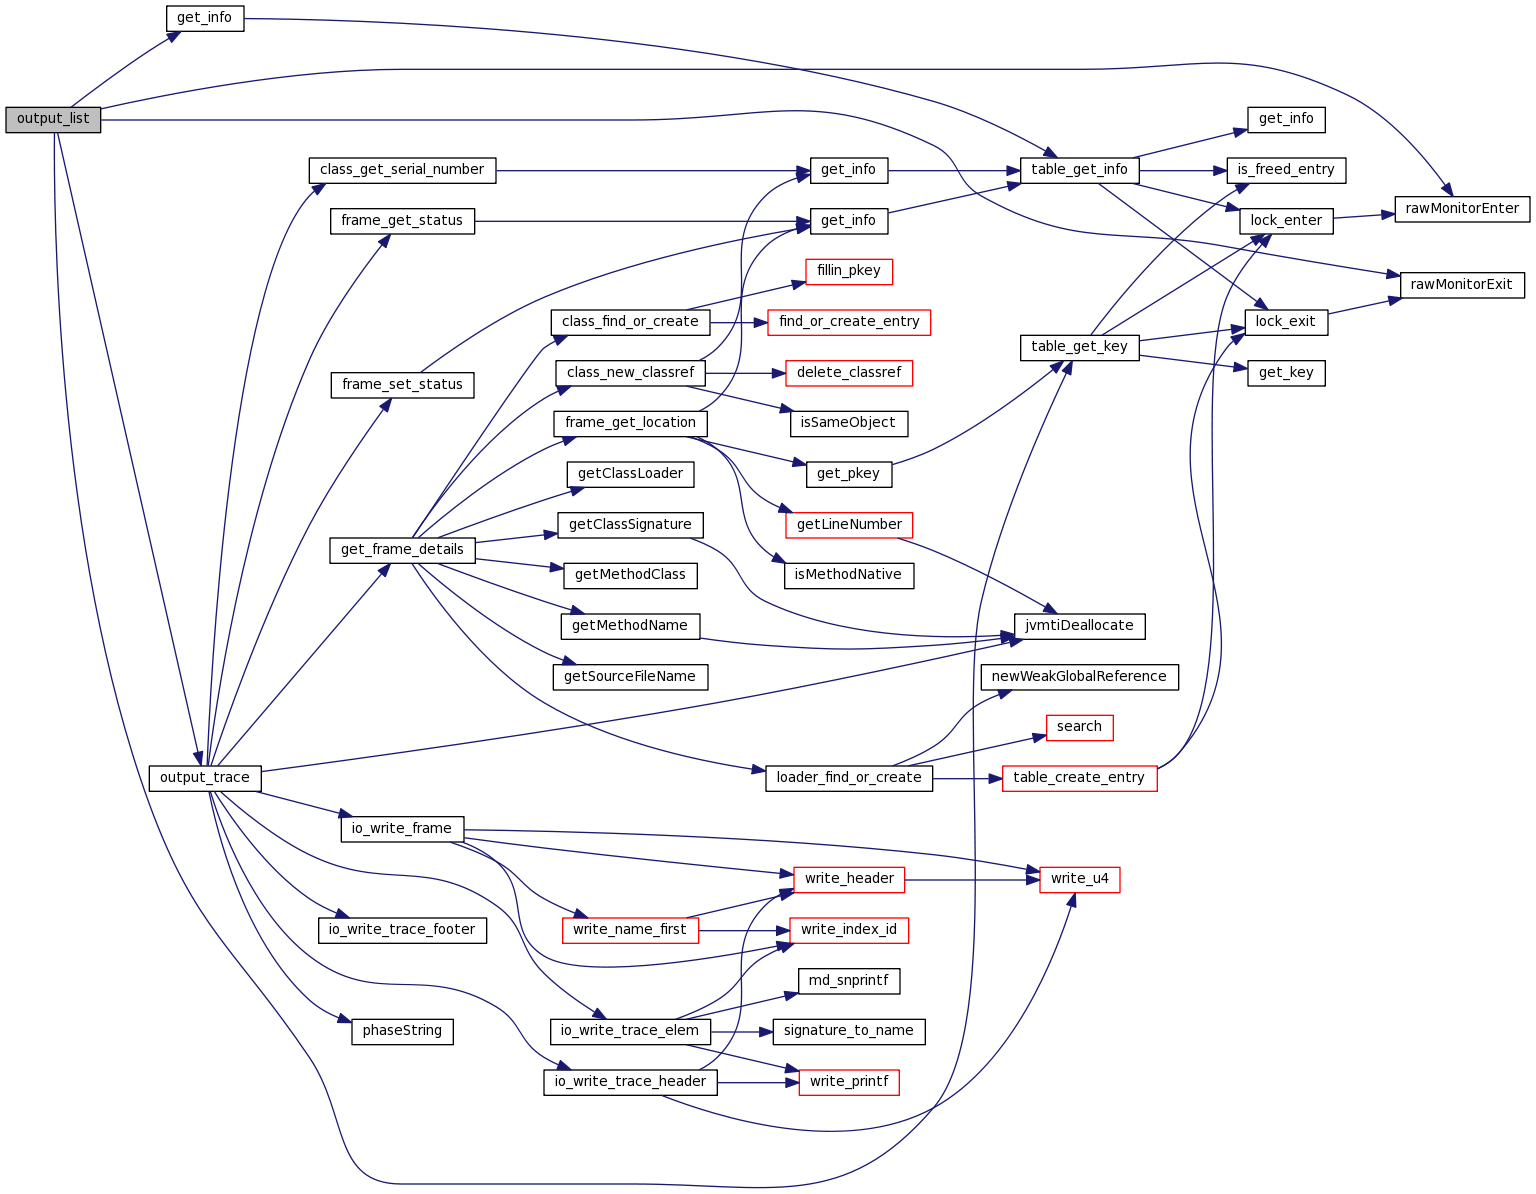
| static void | output_list (JNIEnv *env, TraceIndex *list, jint count) |
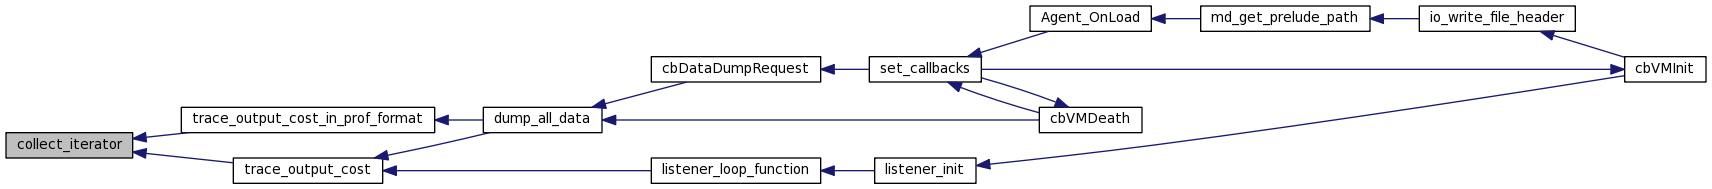
| static void | collect_iterator (TableIndex index, void *key_ptr, int key_len, void *info_ptr, void *arg) |
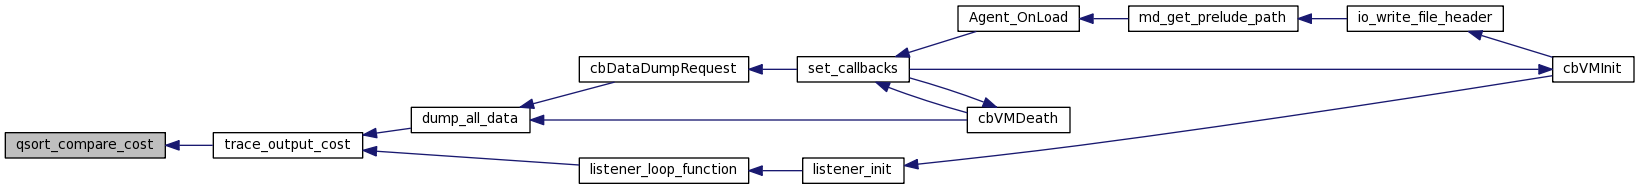
| static int | qsort_compare_cost (const void *p_trace1, const void *p_trace2) |
| static int | qsort_compare_num_hits (const void *p_trace1, const void *p_trace2) |
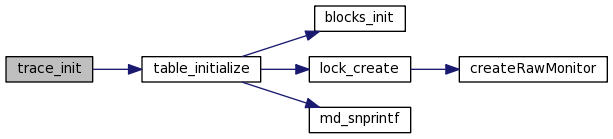
| void | trace_init (void) |
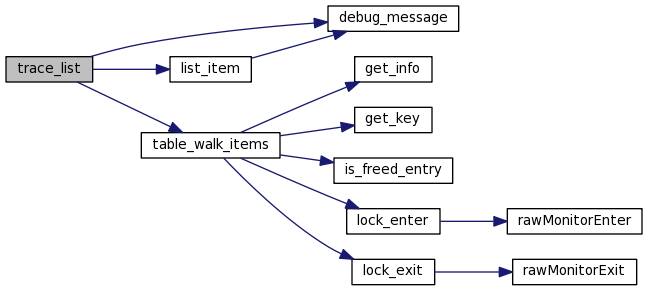
| void | trace_list (void) |
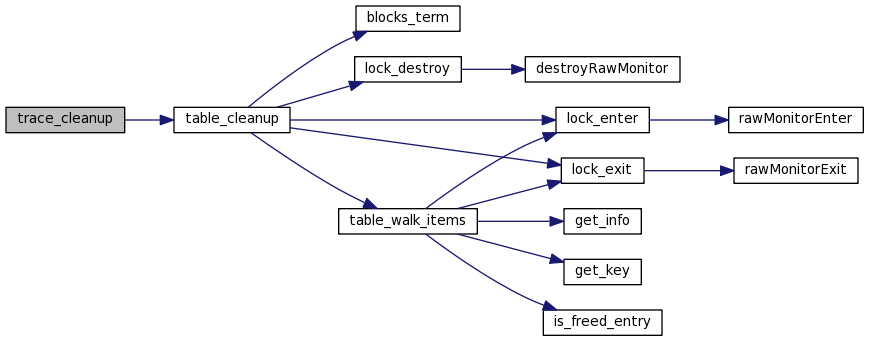
| void | trace_cleanup (void) |
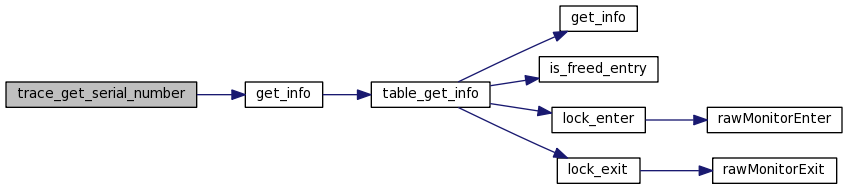
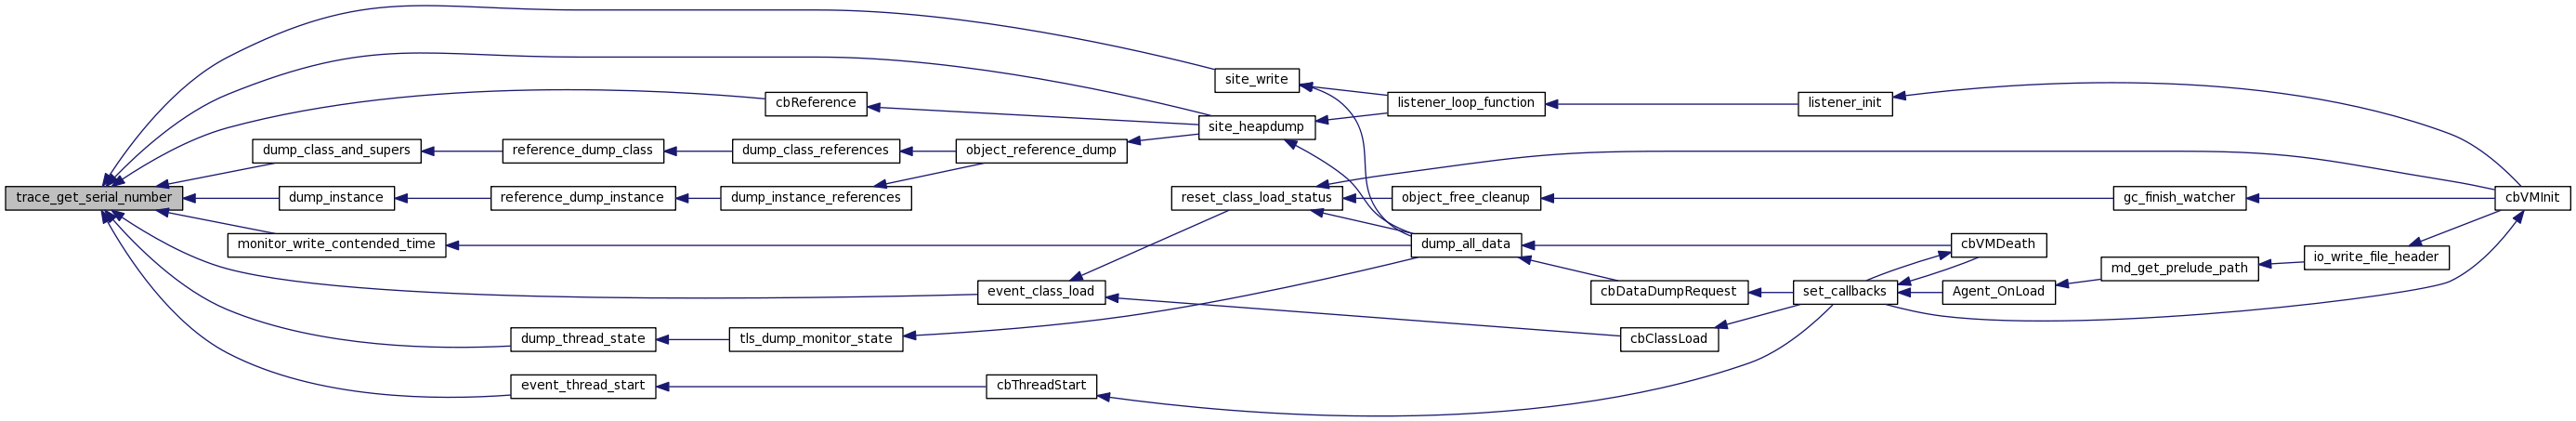
| SerialNumber | trace_get_serial_number (TraceIndex index) |
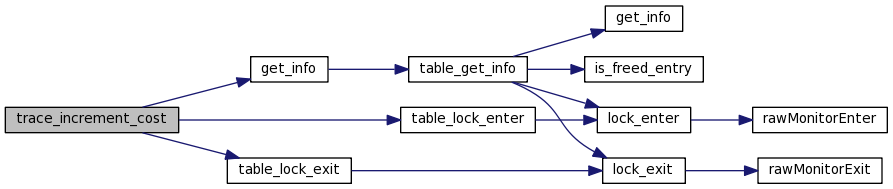
| void | trace_increment_cost (TraceIndex index, jint num_hits, jlong self_cost, jlong total_cost) |
| TraceIndex | trace_find_or_create (SerialNumber thread_serial_num, jint n_frames, FrameIndex *frames, jvmtiFrameInfo *jframes_buffer) |
| static int | get_real_depth (int depth, jboolean skip_init) |
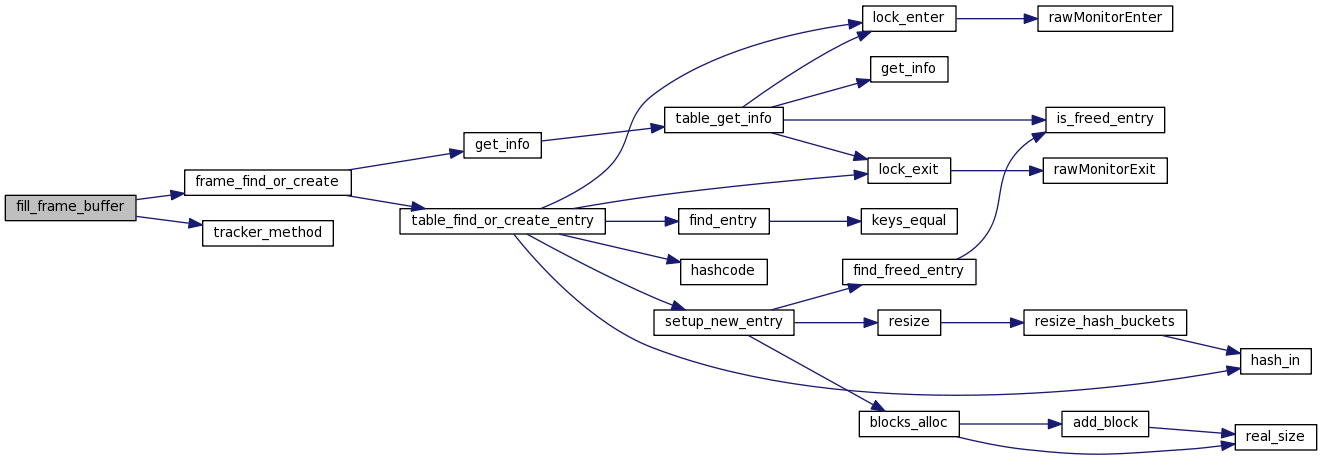
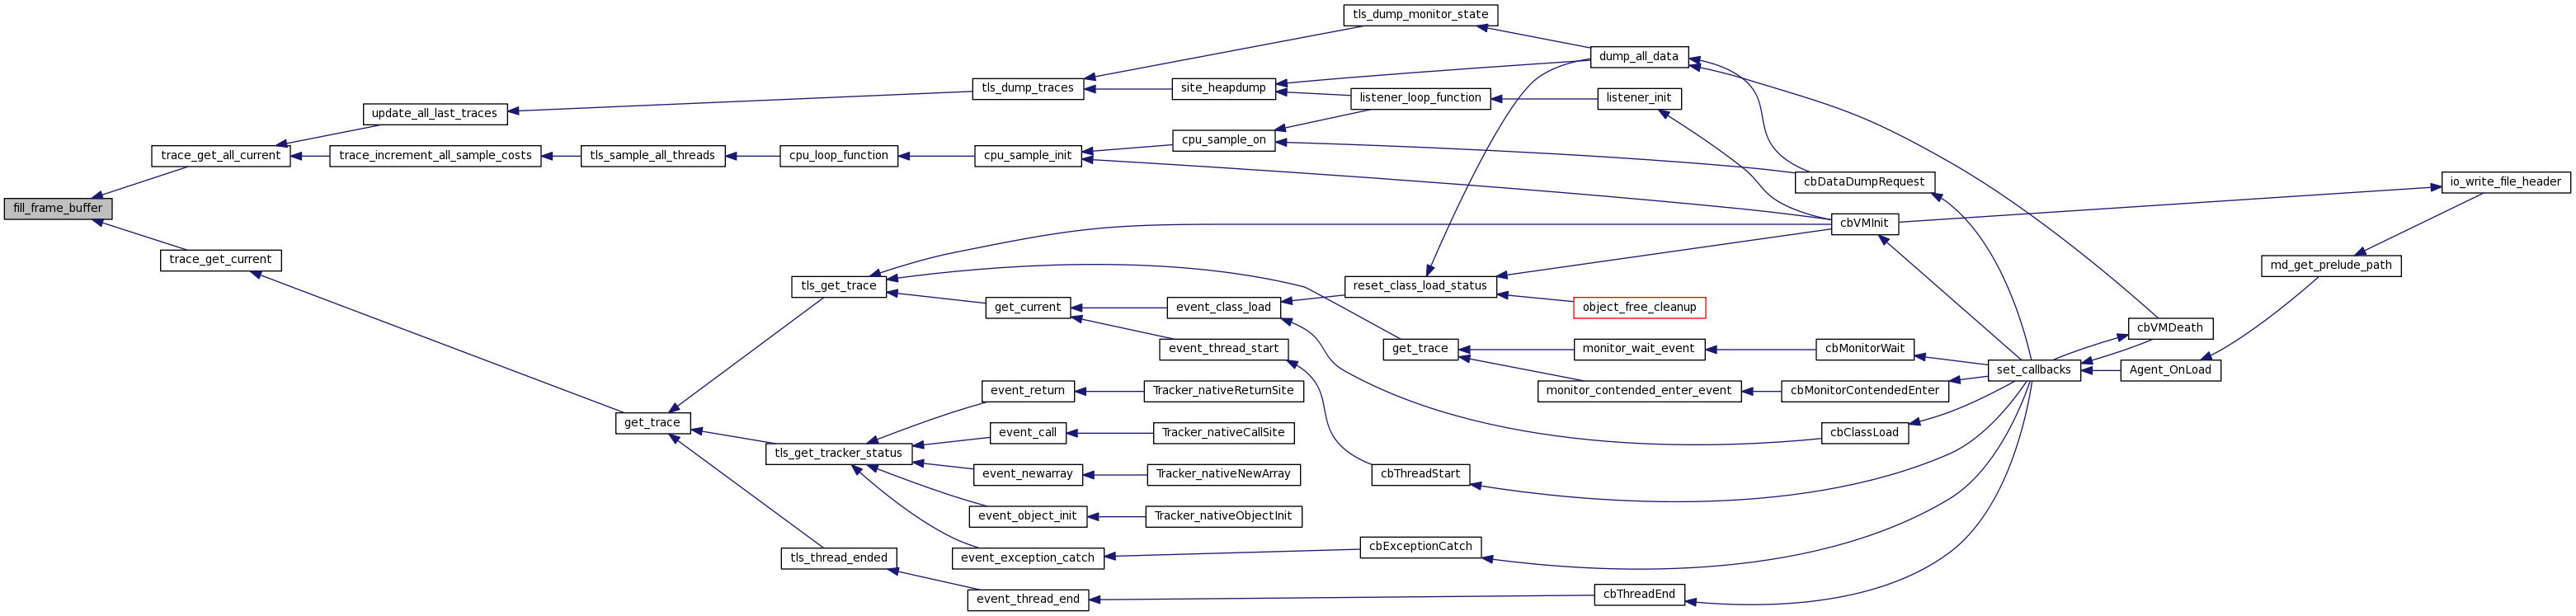
| static int | fill_frame_buffer (int depth, int real_depth, int frame_count, jboolean skip_init, jvmtiFrameInfo *jframes_buffer, FrameIndex *frames_buffer) |
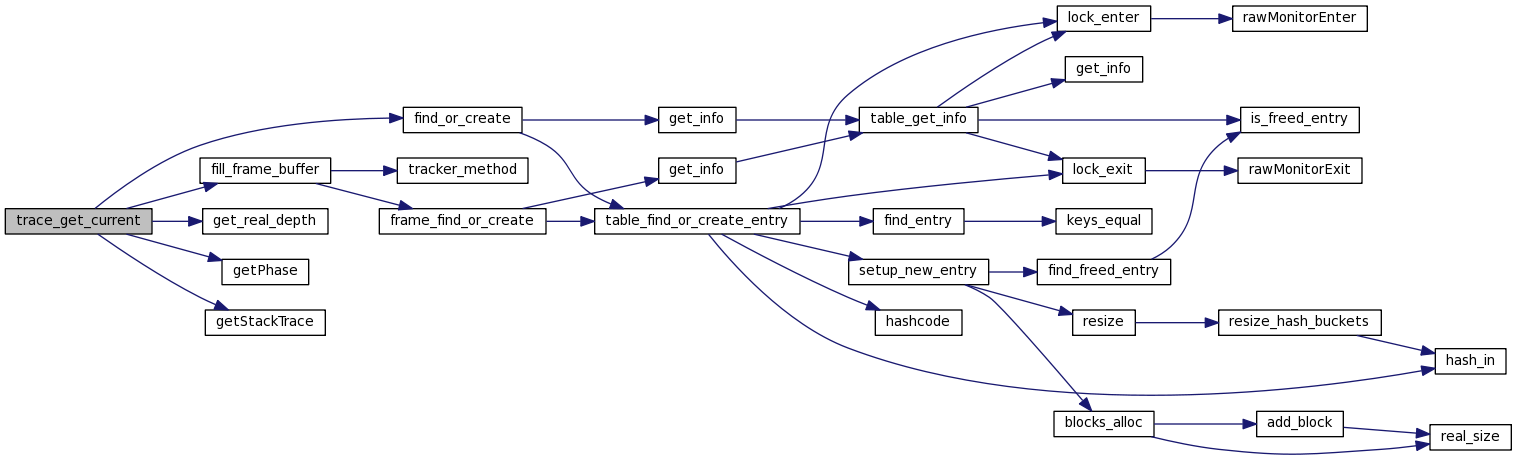
| TraceIndex | trace_get_current (jthread thread, SerialNumber thread_serial_num, int depth, jboolean skip_init, FrameIndex *frames_buffer, jvmtiFrameInfo *jframes_buffer) |
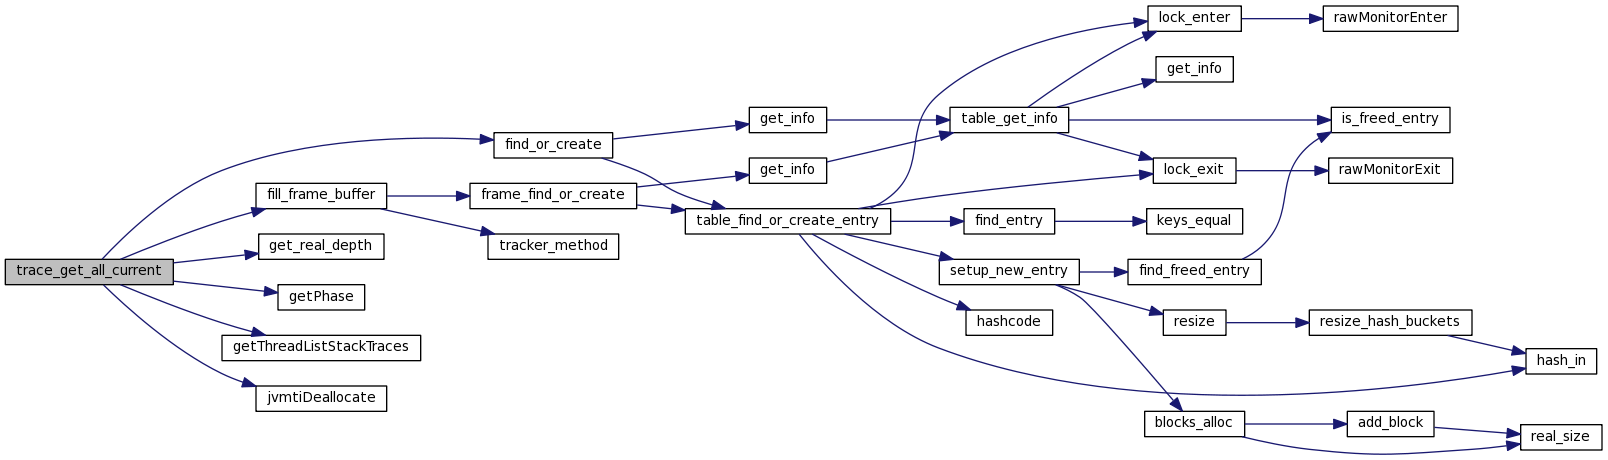
| void | trace_get_all_current (jint thread_count, jthread *threads, SerialNumber *thread_serial_nums, int depth, jboolean skip_init, TraceIndex *traces, jboolean always_care) |
| void | trace_increment_all_sample_costs (jint thread_count, jthread *threads, SerialNumber *thread_serial_nums, int depth, jboolean skip_init) |
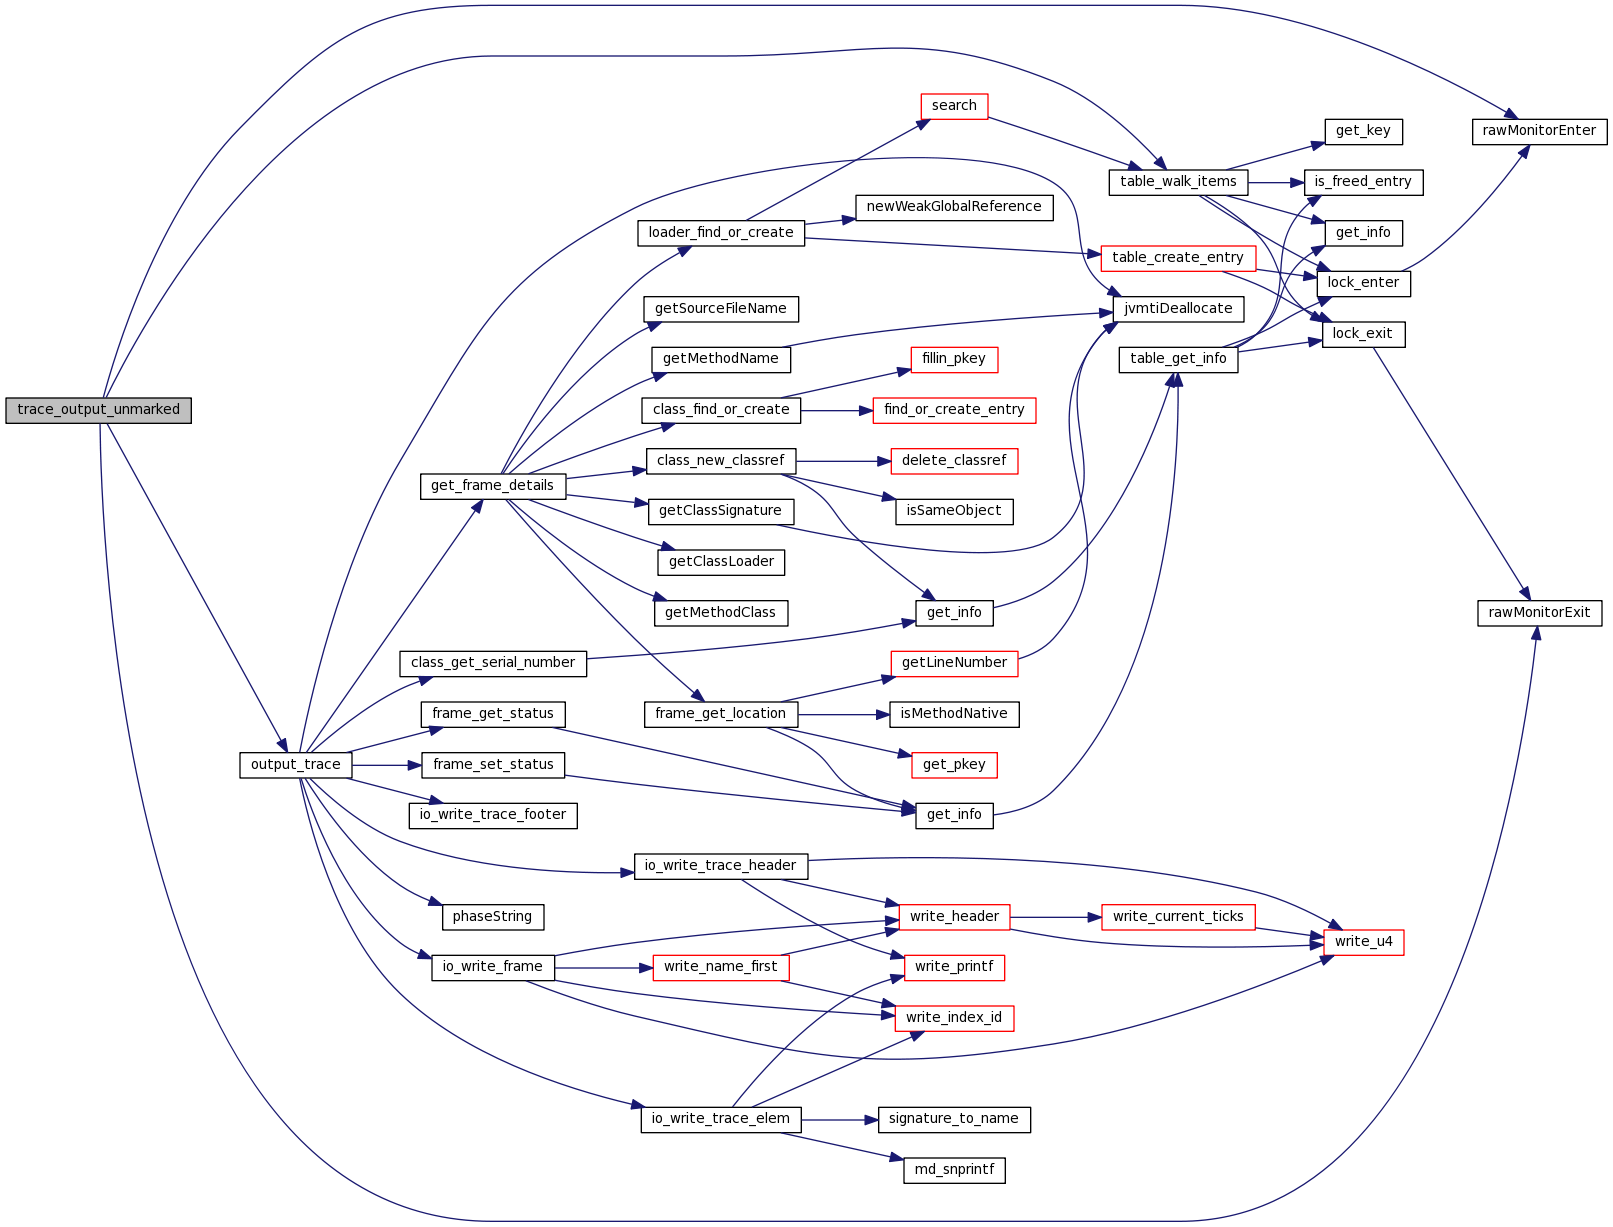
| void | trace_output_unmarked (JNIEnv *env) |
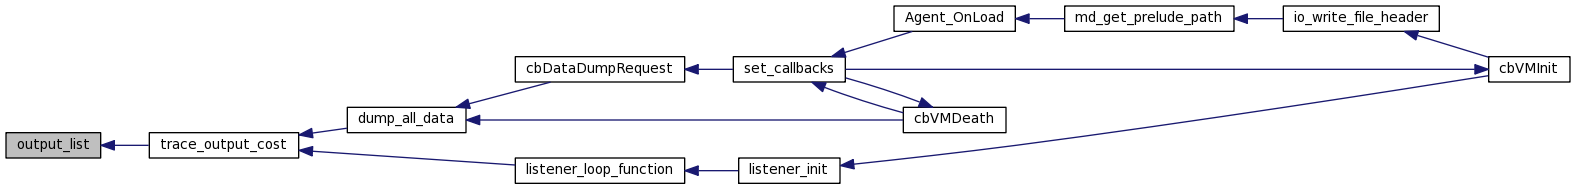
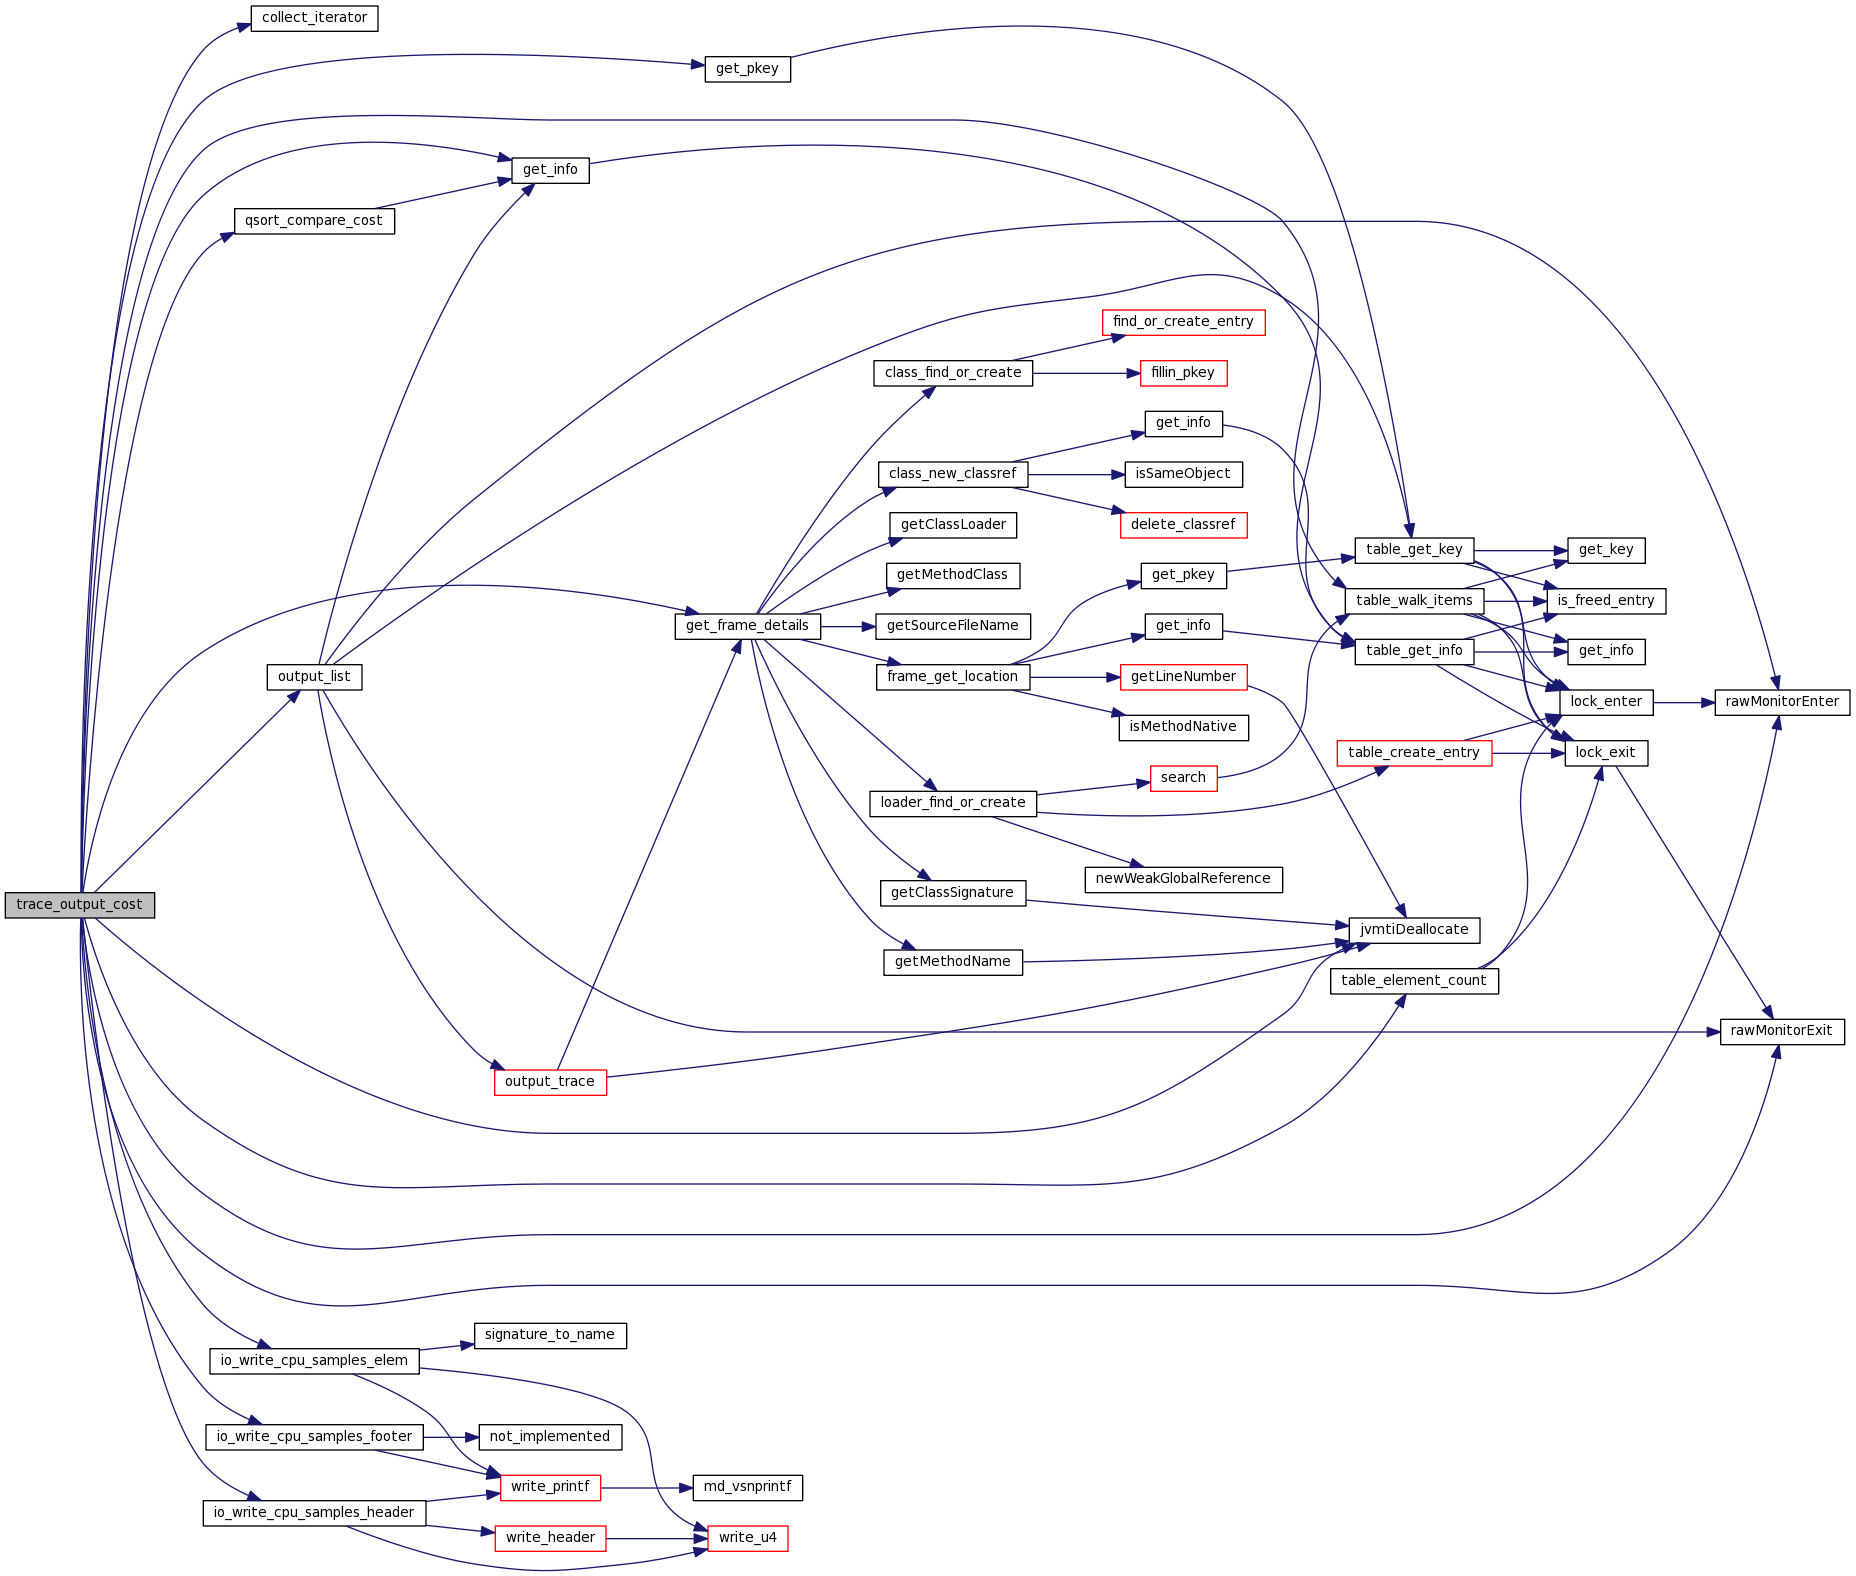
| void | trace_output_cost (JNIEnv *env, double cutoff) |
| void | trace_output_cost_in_prof_format (JNIEnv *env) |
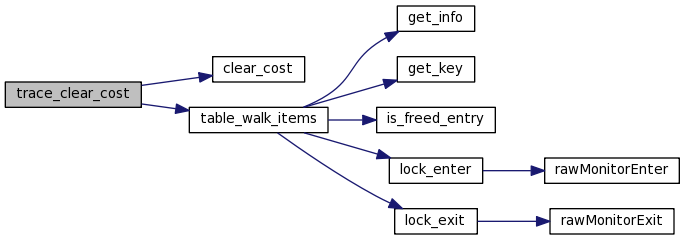
| void | trace_clear_cost (void) |
Function Documentation
| static void clear_cost | ( | TableIndex | i, | |
| void * | key_ptr, | |||
| int | key_len, | |||
| void * | info_ptr, | |||
| void * | arg | |||
| ) | [static] |

| static void collect_iterator | ( | TableIndex | index, | |
| void * | key_ptr, | |||
| int | key_len, | |||
| void * | info_ptr, | |||
| void * | arg | |||
| ) | [static] |
| static int fill_frame_buffer | ( | int | depth, | |
| int | real_depth, | |||
| int | frame_count, | |||
| jboolean | skip_init, | |||
| jvmtiFrameInfo * | jframes_buffer, | |||
| FrameIndex * | frames_buffer | |||
| ) | [static] |
Definition at line 474 of file hprof_trace.c.
| static TraceIndex find_or_create | ( | SerialNumber | thread_serial_num, | |
| jint | n_frames, | |||
| FrameIndex * | frames, | |||
| jvmtiPhase | phase, | |||
| TraceKey * | trace_key_buffer | |||
| ) | [static] |
Definition at line 110 of file hprof_trace.c.
| static void get_frame_details | ( | JNIEnv * | env, | |
| FrameIndex | frame_index, | |||
| SerialNumber * | frame_serial_num, | |||
| char ** | pcsig, | |||
| ClassIndex * | pcnum, | |||
| char ** | pmname, | |||
| char ** | pmsig, | |||
| char ** | psname, | |||
| jint * | plineno | |||
| ) | [static] |
Definition at line 193 of file hprof_trace.c.
| static TraceInfo* get_info | ( | TraceIndex | index | ) | [static] |
Definition at line 101 of file hprof_trace.c.
| static TraceKey* get_pkey | ( | TraceIndex | index | ) | [static] |
Definition at line 86 of file hprof_trace.c.
| static int get_real_depth | ( | int | depth, | |
| jboolean | skip_init | |||
| ) | [static] |

| static void list_item | ( | TableIndex | index, | |
| void * | key_ptr, | |||
| int | key_len, | |||
| void * | info_ptr, | |||
| void * | arg | |||
| ) | [static] |
Definition at line 146 of file hprof_trace.c.

| static void output_list | ( | JNIEnv * | env, | |
| TraceIndex * | list, | |||
| jint | count | |||
| ) | [static] |
Definition at line 325 of file hprof_trace.c.
| static void output_trace | ( | TableIndex | index, | |
| void * | key_ptr, | |||
| int | key_len, | |||
| void * | info_ptr, | |||
| void * | arg | |||
| ) | [static] |
Definition at line 241 of file hprof_trace.c.
| static int qsort_compare_cost | ( | const void * | p_trace1, | |
| const void * | p_trace2 | |||
| ) | [static] |
Definition at line 361 of file hprof_trace.c.
| static int qsort_compare_num_hits | ( | const void * | p_trace1, | |
| const void * | p_trace2 | |||
| ) | [static] |
Definition at line 379 of file hprof_trace.c.


| void trace_cleanup | ( | void | ) |
Definition at line 415 of file hprof_trace.c.
| void trace_clear_cost | ( | void | ) |
Definition at line 862 of file hprof_trace.c.

| TraceIndex trace_find_or_create | ( | SerialNumber | thread_serial_num, | |
| jint | n_frames, | |||
| FrameIndex * | frames, | |||
| jvmtiFrameInfo * | jframes_buffer | |||
| ) |
Definition at line 447 of file hprof_trace.c.


| void trace_get_all_current | ( | jint | thread_count, | |
| jthread * | threads, | |||
| SerialNumber * | thread_serial_nums, | |||
| int | depth, | |||
| jboolean | skip_init, | |||
| TraceIndex * | traces, | |||
| jboolean | always_care | |||
| ) |
Definition at line 560 of file hprof_trace.c.

| TraceIndex trace_get_current | ( | jthread | thread, | |
| SerialNumber | thread_serial_num, | |||
| int | depth, | |||
| jboolean | skip_init, | |||
| FrameIndex * | frames_buffer, | |||
| jvmtiFrameInfo * | jframes_buffer | |||
| ) |
Definition at line 525 of file hprof_trace.c.
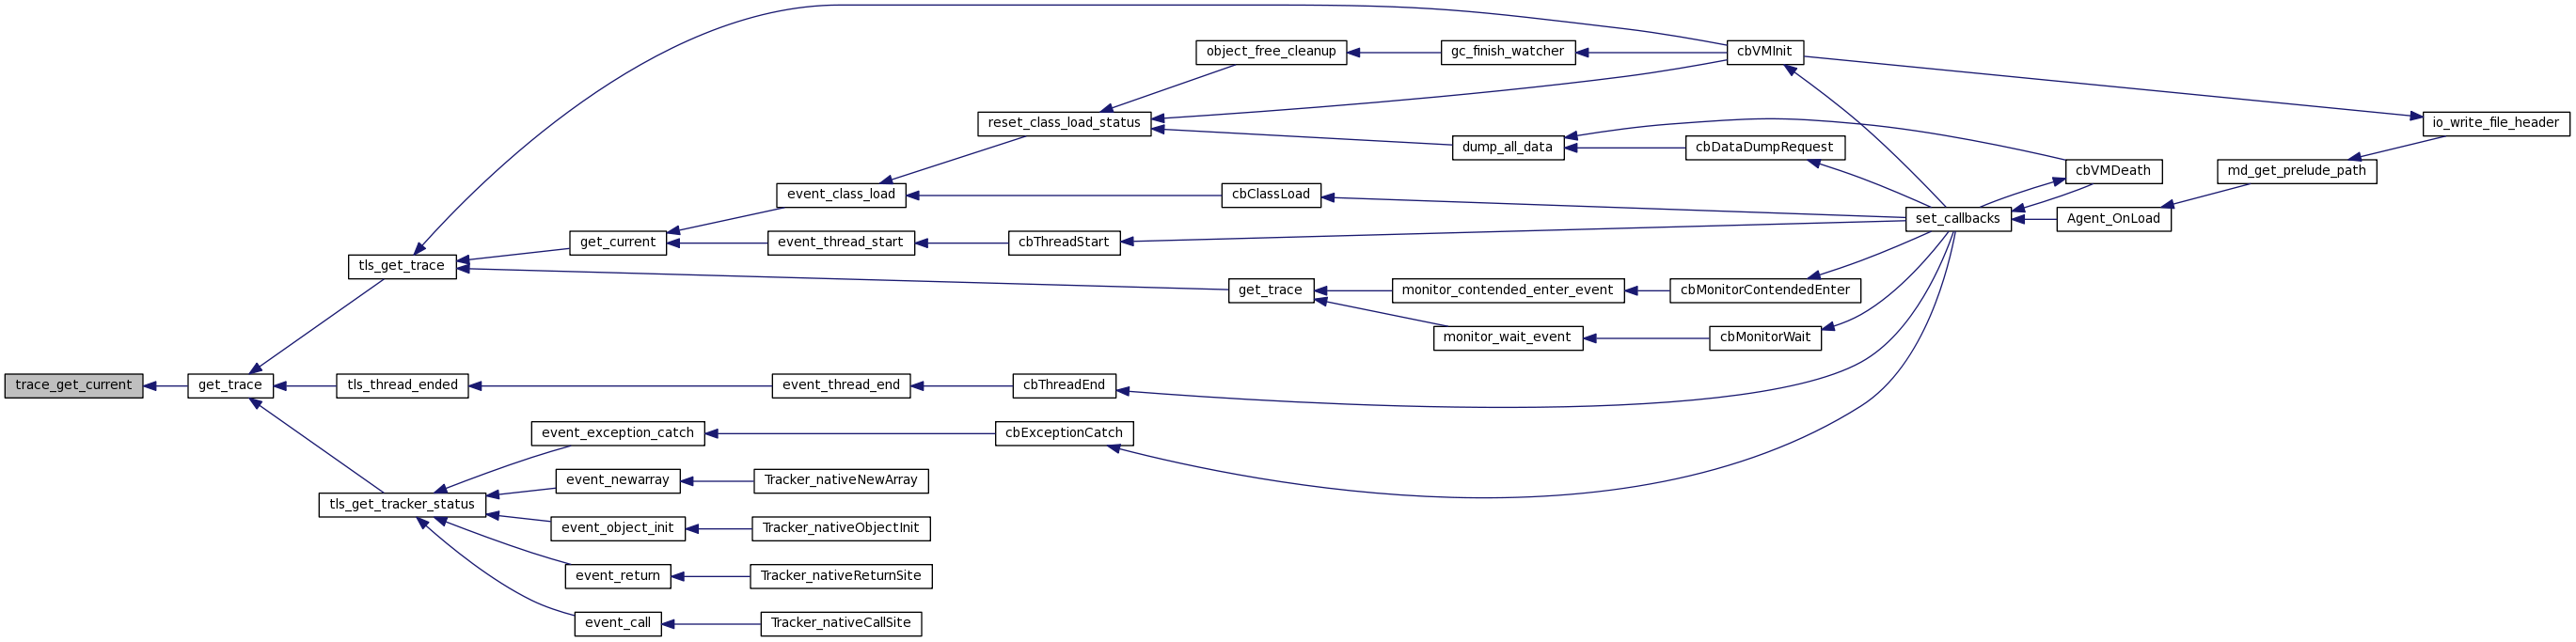
| SerialNumber trace_get_serial_number | ( | TraceIndex | index | ) |
Definition at line 422 of file hprof_trace.c.
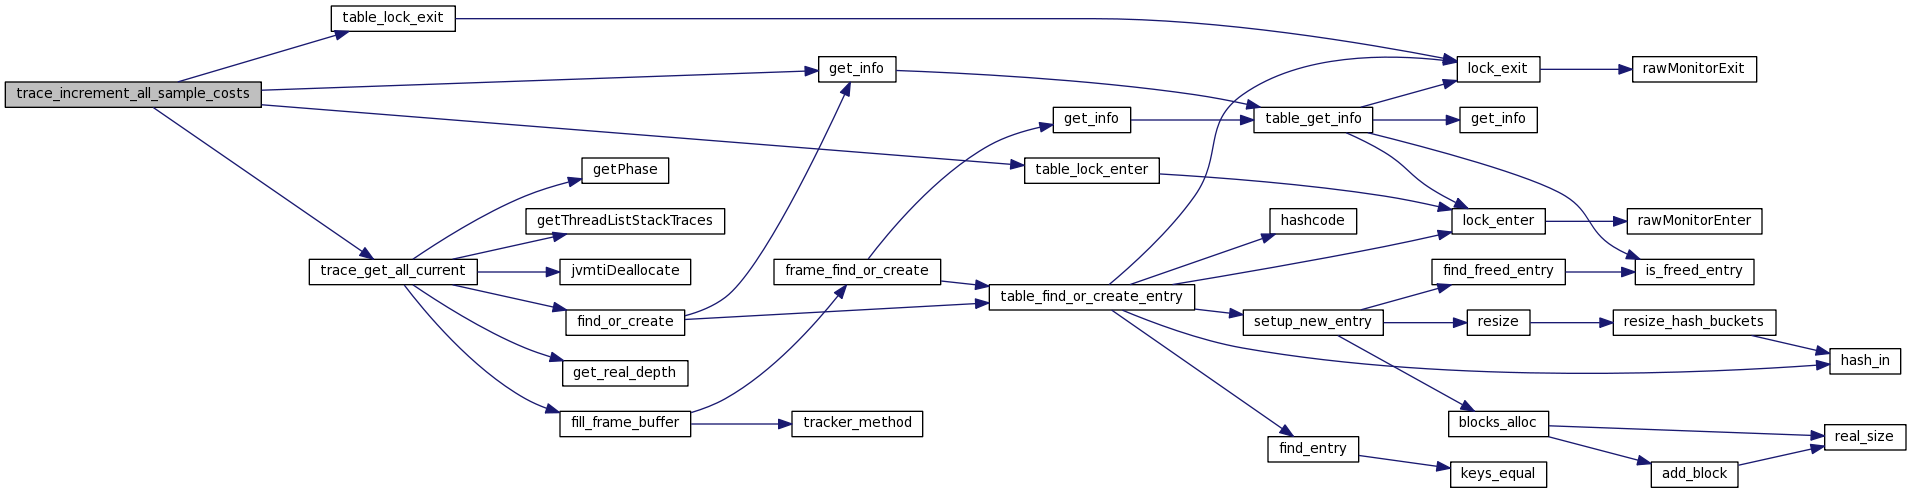
| void trace_increment_all_sample_costs | ( | jint | thread_count, | |
| jthread * | threads, | |||
| SerialNumber * | thread_serial_nums, | |||
| int | depth, | |||
| jboolean | skip_init | |||
| ) |
Definition at line 629 of file hprof_trace.c.

| void trace_increment_cost | ( | TraceIndex | index, | |
| jint | num_hits, | |||
| jlong | self_cost, | |||
| jlong | total_cost | |||
| ) |
Definition at line 434 of file hprof_trace.c.

| void trace_init | ( | void | ) |
Definition at line 398 of file hprof_trace.c.

| void trace_list | ( | void | ) |
Definition at line 405 of file hprof_trace.c.

| void trace_output_cost | ( | JNIEnv * | env, | |
| double | cutoff | |||
| ) |
Definition at line 684 of file hprof_trace.c.
| void trace_output_cost_in_prof_format | ( | JNIEnv * | env | ) |
Definition at line 775 of file hprof_trace.c.

| void trace_output_unmarked | ( | JNIEnv * | env | ) |
Definition at line 675 of file hprof_trace.c.