hprof_trace.h File Reference
This graph shows which files directly or indirectly include this file:

Go to the source code of this file.
Functions | |
| void | trace_increment_all_sample_costs (jint count, jthread *threads, SerialNumber *thread_serial_nums, int depth, jboolean skip_init) |
| void | trace_get_all_current (jint count, jthread *threads, SerialNumber *thread_serial_nums, int depth, jboolean skip_init, TraceIndex *traces, jboolean always_care) |
| TraceIndex | trace_get_current (jthread thread, SerialNumber thread_serial_num, int depth, jboolean skip_init, FrameIndex *frames_buffer, jvmtiFrameInfo *jframes_buffer) |
| void | trace_init (void) |
| TraceIndex | trace_find_or_create (SerialNumber thread_serial_num, jint n_frames, FrameIndex *frames, jvmtiFrameInfo *jframes_buffer) |
| SerialNumber | trace_get_serial_number (TraceIndex index) |
| void | trace_increment_cost (TraceIndex index, jint num_hits, jlong self_cost, jlong total_cost) |
| void | trace_list (void) |
| void | trace_cleanup (void) |
| void | trace_clear_cost (void) |
| void | trace_output_unmarked (JNIEnv *env) |
| void | trace_output_cost (JNIEnv *env, double cutoff) |
| void | trace_output_cost_in_prof_format (JNIEnv *env) |
Function Documentation
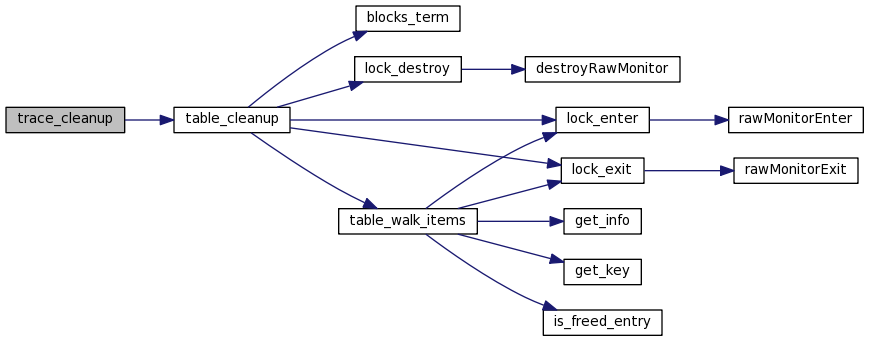
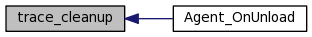
| void trace_cleanup | ( | void | ) |
Definition at line 415 of file hprof_trace.c.
Here is the call graph for this function:
Here is the caller graph for this function:
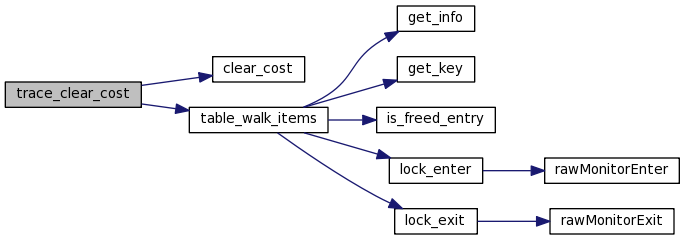
| void trace_clear_cost | ( | void | ) |
Definition at line 862 of file hprof_trace.c.
Here is the call graph for this function:
Here is the caller graph for this function:

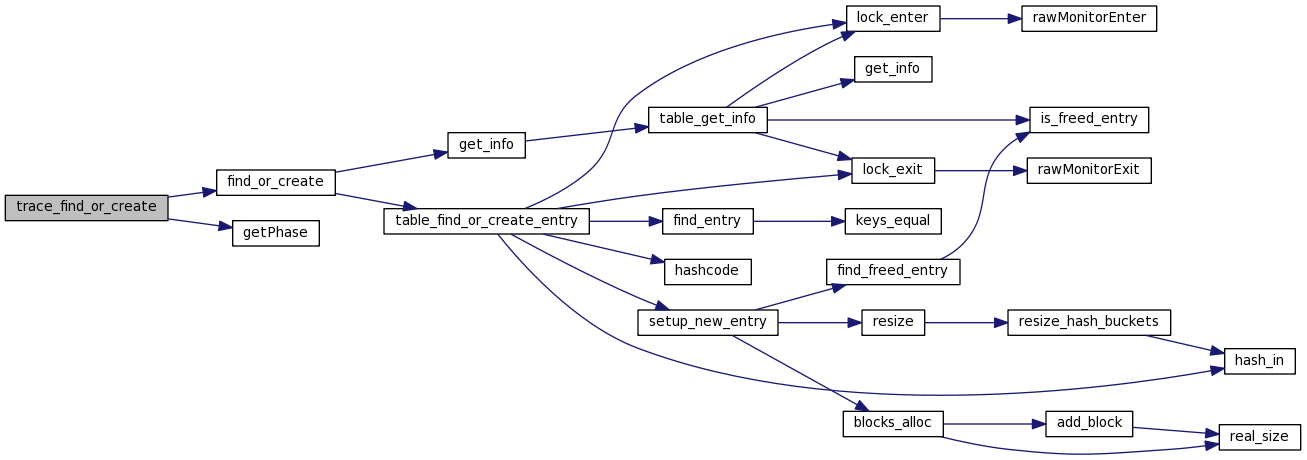
| TraceIndex trace_find_or_create | ( | SerialNumber | thread_serial_num, | |
| jint | n_frames, | |||
| FrameIndex * | frames, | |||
| jvmtiFrameInfo * | jframes_buffer | |||
| ) |
Definition at line 447 of file hprof_trace.c.
Here is the call graph for this function:
Here is the caller graph for this function:

| void trace_get_all_current | ( | jint | count, | |
| jthread * | threads, | |||
| SerialNumber * | thread_serial_nums, | |||
| int | depth, | |||
| jboolean | skip_init, | |||
| TraceIndex * | traces, | |||
| jboolean | always_care | |||
| ) |
Definition at line 560 of file hprof_trace.c.
Here is the call graph for this function:

Here is the caller graph for this function:

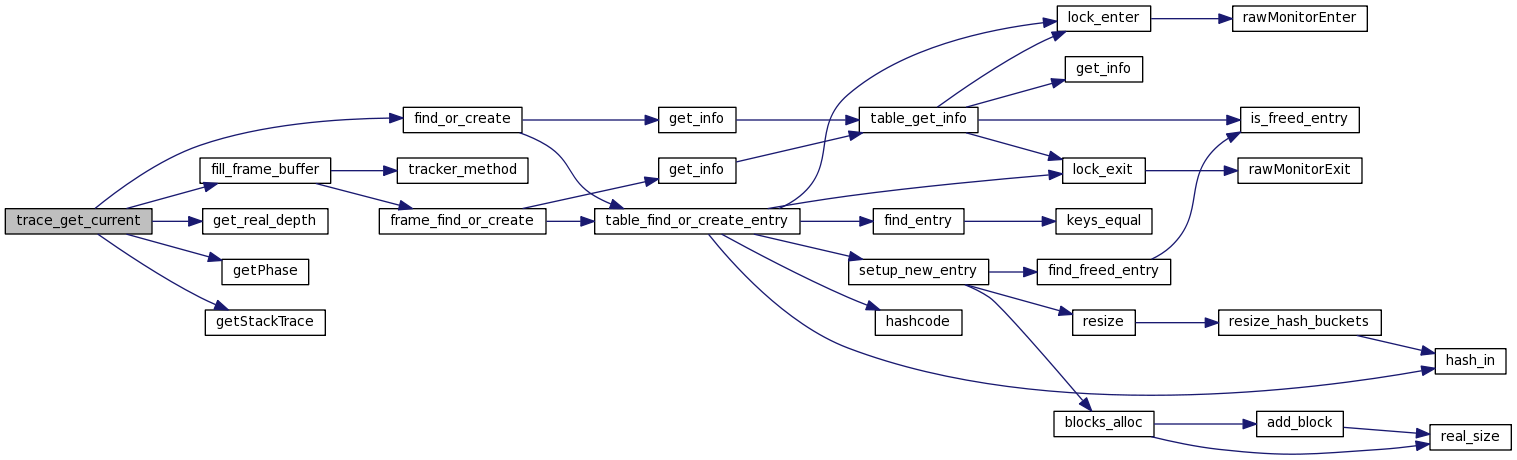
| TraceIndex trace_get_current | ( | jthread | thread, | |
| SerialNumber | thread_serial_num, | |||
| int | depth, | |||
| jboolean | skip_init, | |||
| FrameIndex * | frames_buffer, | |||
| jvmtiFrameInfo * | jframes_buffer | |||
| ) |
Definition at line 525 of file hprof_trace.c.
Here is the call graph for this function:
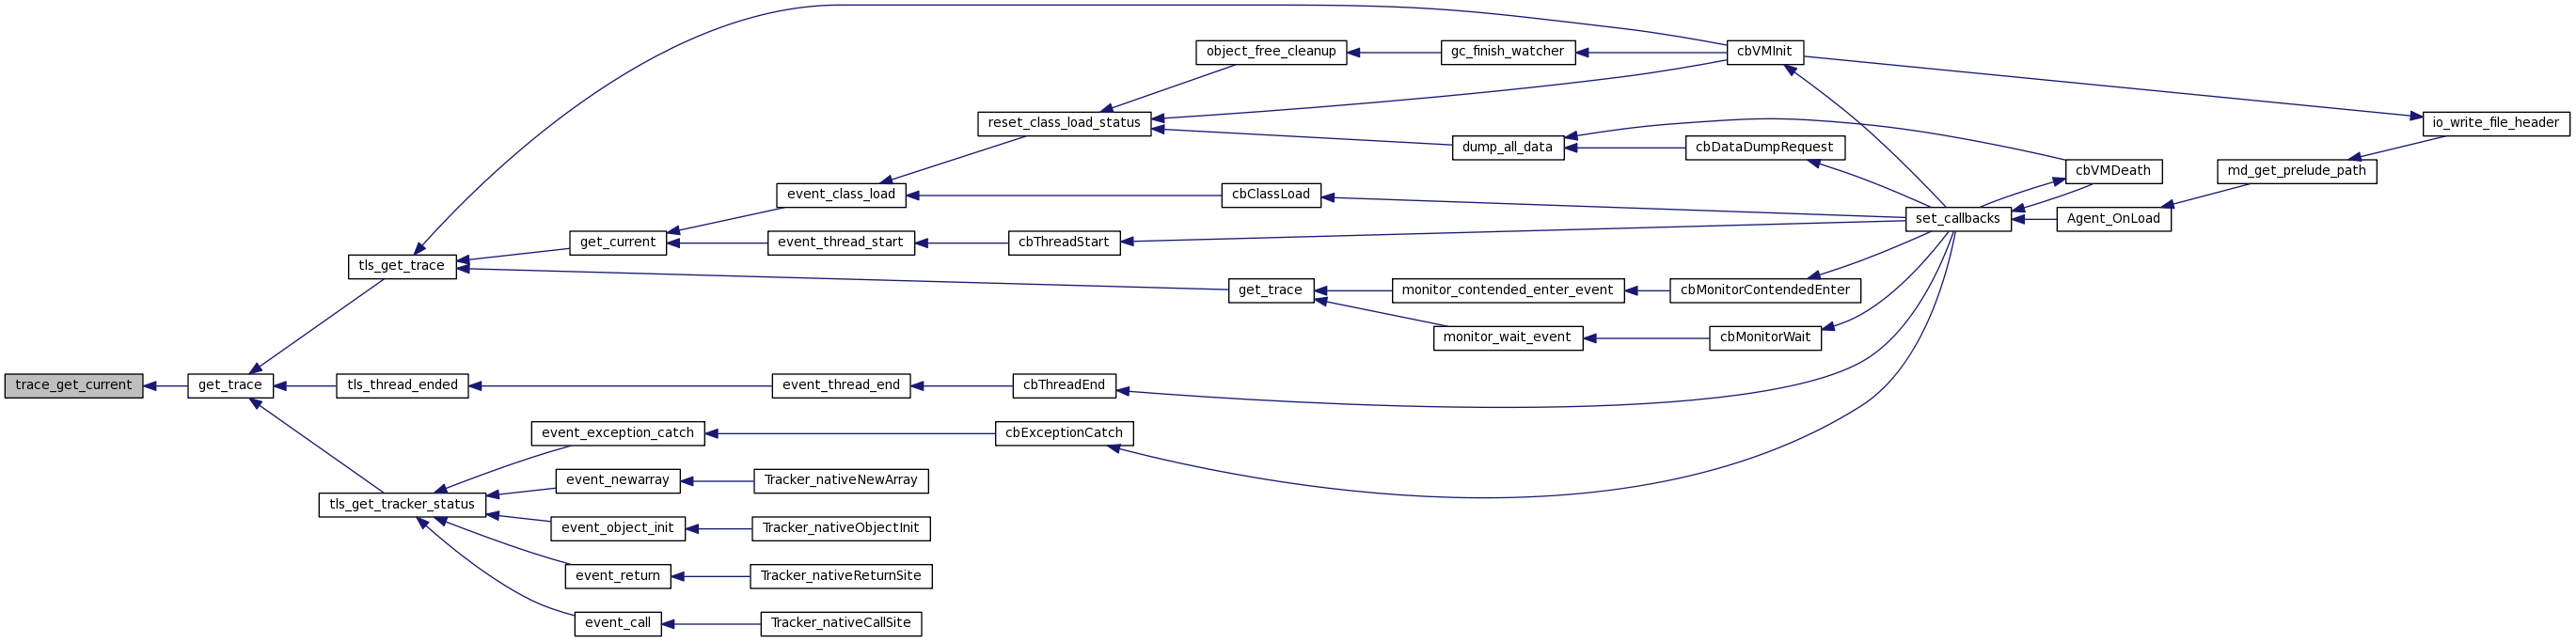
Here is the caller graph for this function:
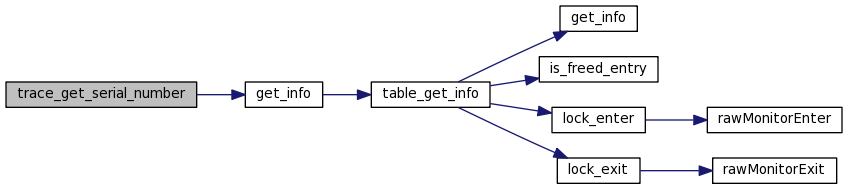
| SerialNumber trace_get_serial_number | ( | TraceIndex | index | ) |
Definition at line 422 of file hprof_trace.c.
Here is the call graph for this function:
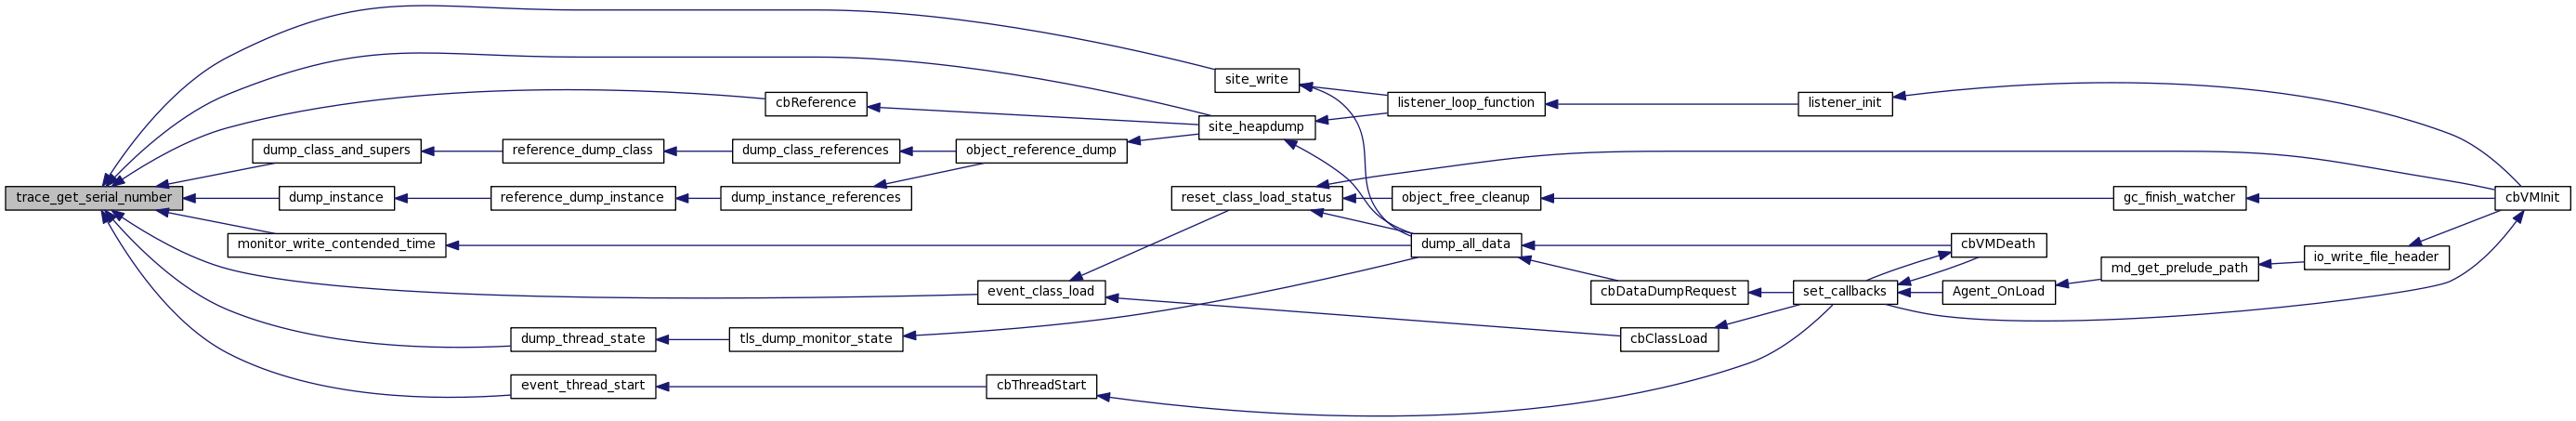
Here is the caller graph for this function:
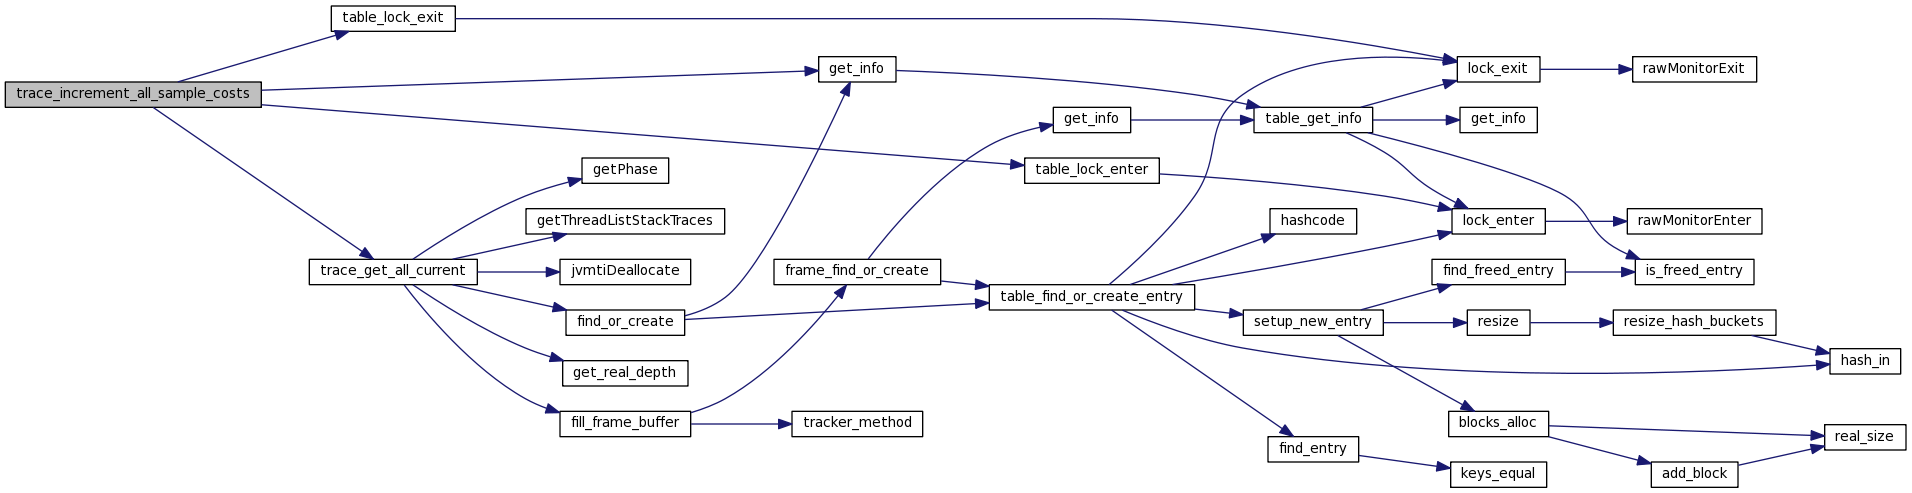
| void trace_increment_all_sample_costs | ( | jint | count, | |
| jthread * | threads, | |||
| SerialNumber * | thread_serial_nums, | |||
| int | depth, | |||
| jboolean | skip_init | |||
| ) |
Definition at line 629 of file hprof_trace.c.
Here is the call graph for this function:
Here is the caller graph for this function:

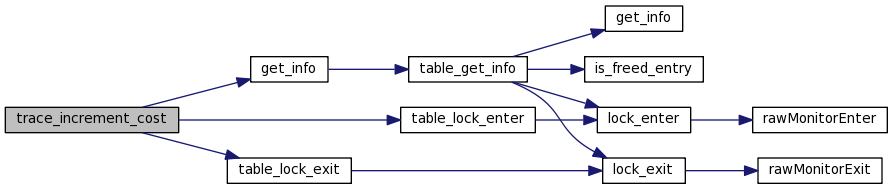
| void trace_increment_cost | ( | TraceIndex | index, | |
| jint | num_hits, | |||
| jlong | self_cost, | |||
| jlong | total_cost | |||
| ) |
Definition at line 434 of file hprof_trace.c.
Here is the call graph for this function:
Here is the caller graph for this function:

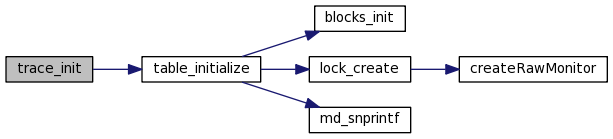
| void trace_init | ( | void | ) |
Definition at line 398 of file hprof_trace.c.
Here is the call graph for this function:
Here is the caller graph for this function:

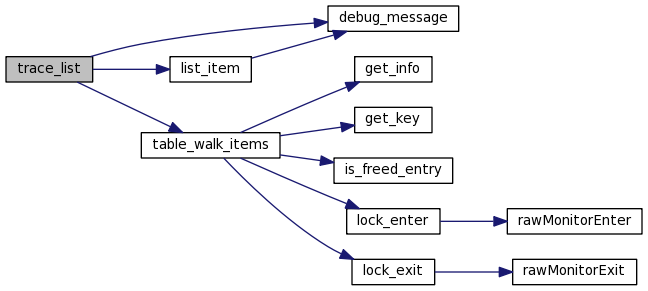
| void trace_list | ( | void | ) |
Definition at line 405 of file hprof_trace.c.
Here is the call graph for this function:
Here is the caller graph for this function:

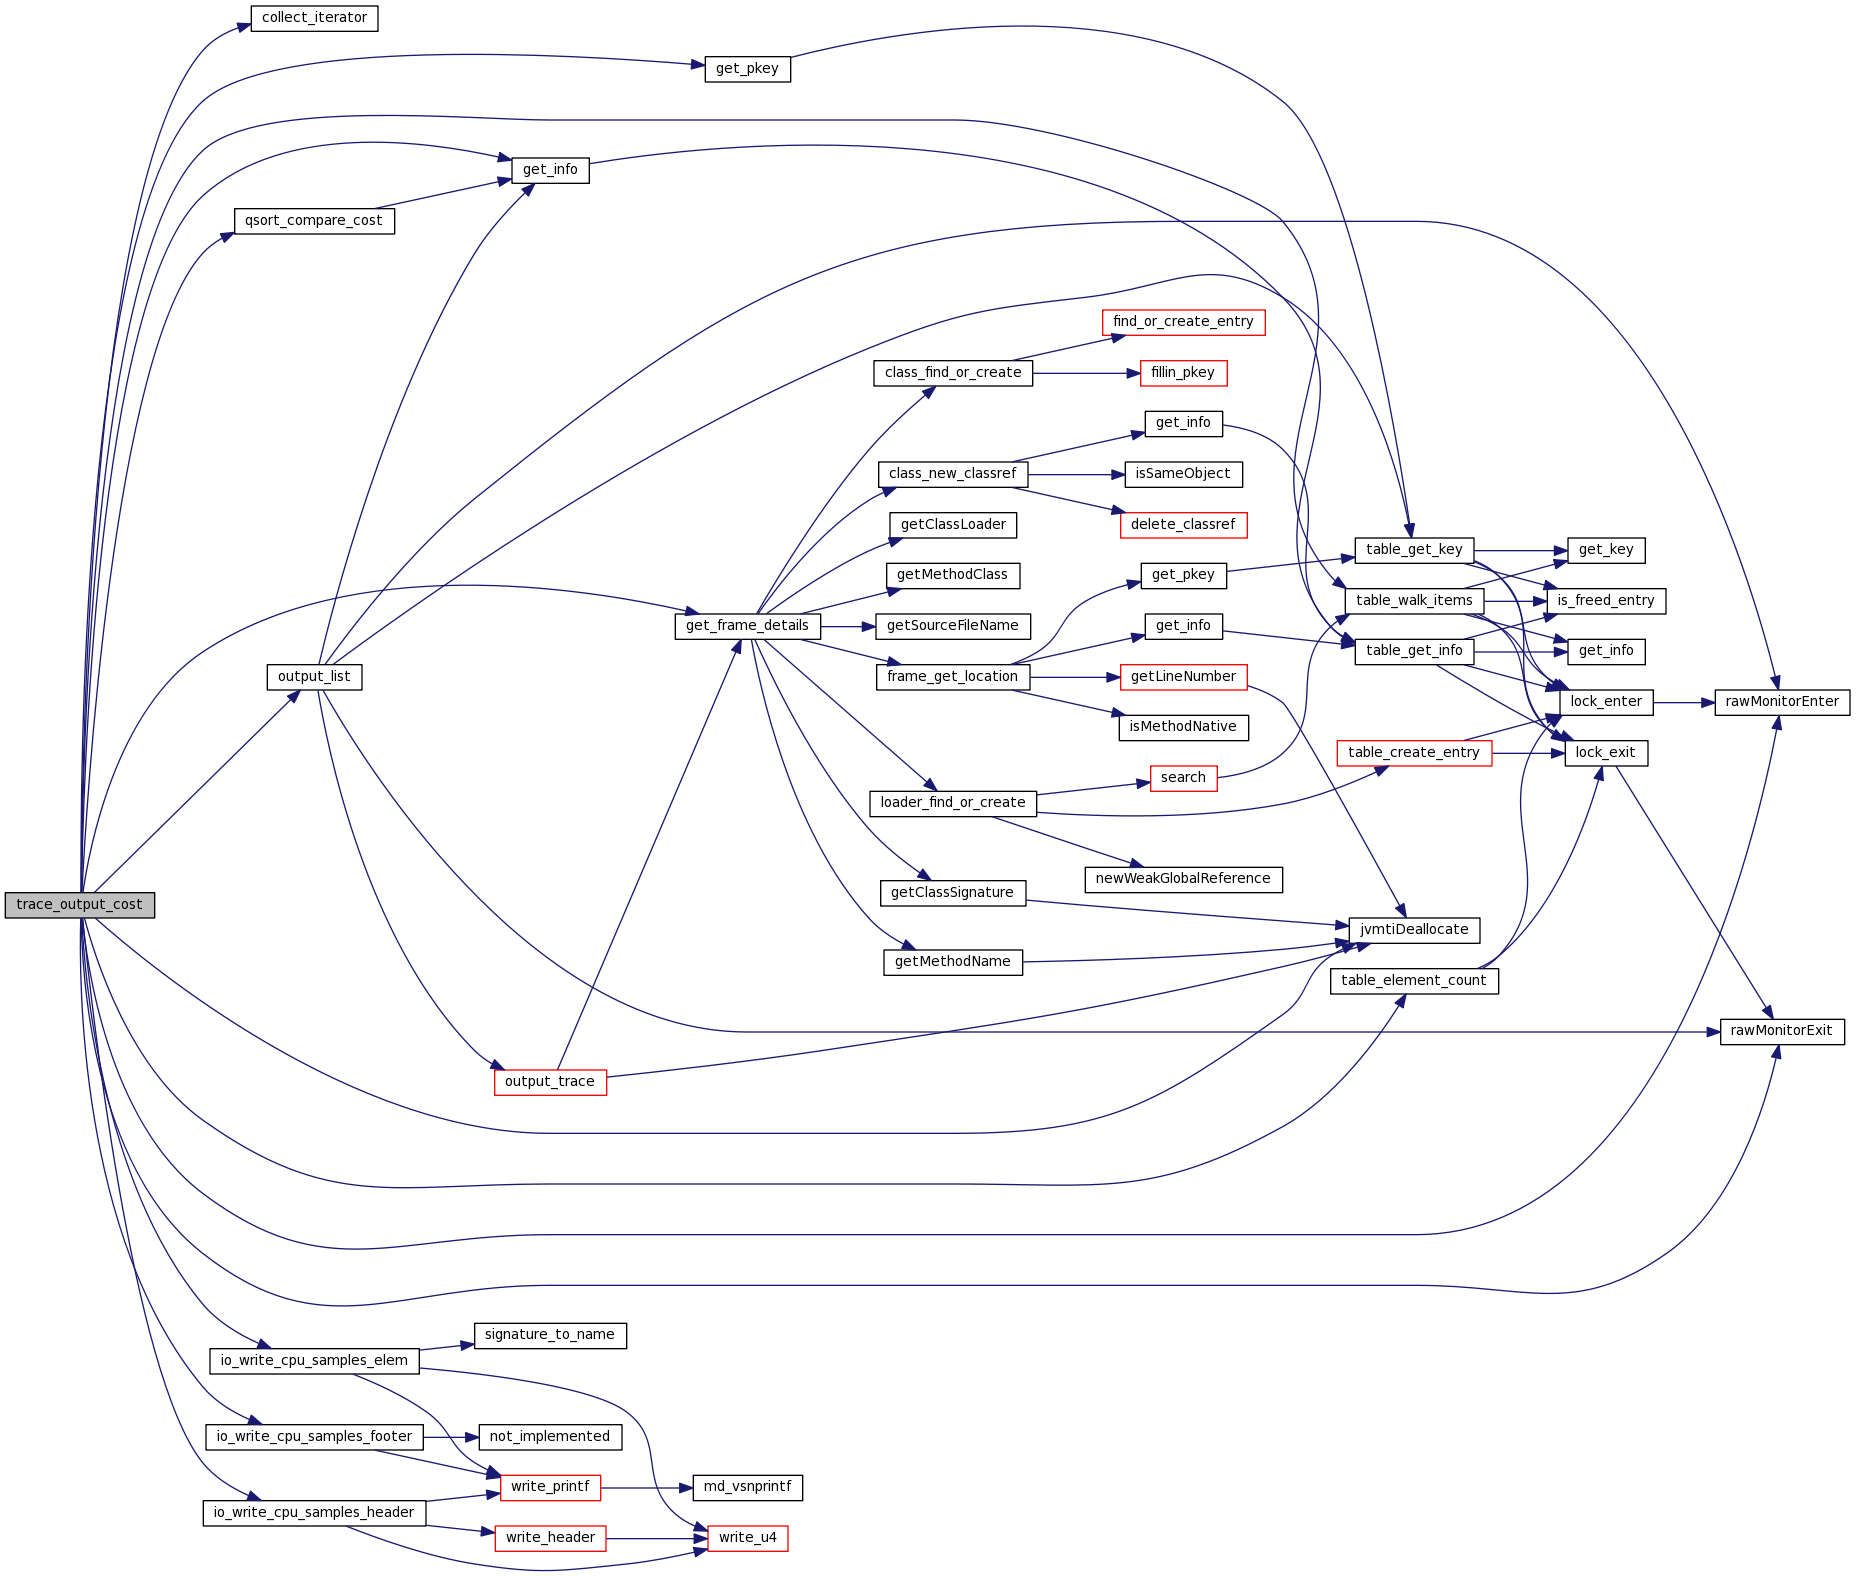
| void trace_output_cost | ( | JNIEnv * | env, | |
| double | cutoff | |||
| ) |
Definition at line 684 of file hprof_trace.c.
Here is the call graph for this function:
Here is the caller graph for this function:
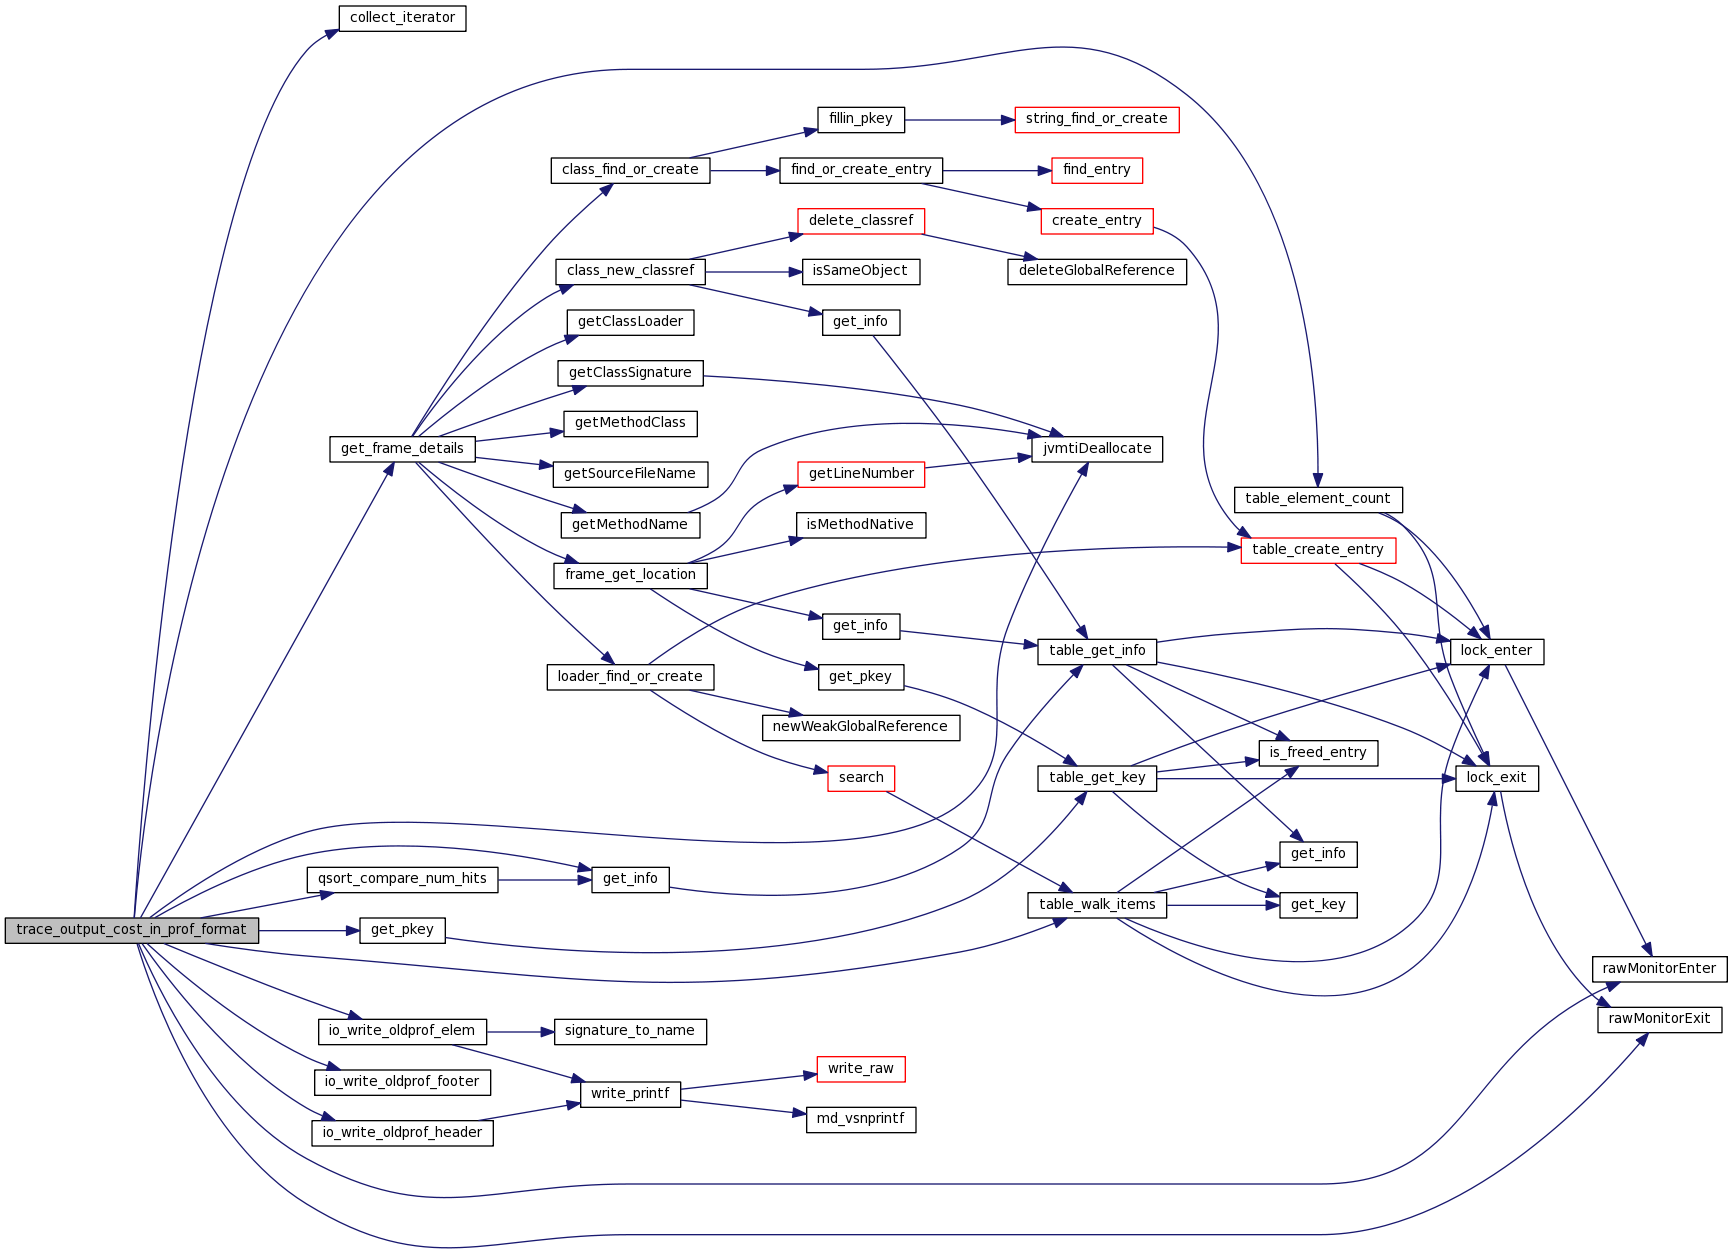
| void trace_output_cost_in_prof_format | ( | JNIEnv * | env | ) |
Definition at line 775 of file hprof_trace.c.
Here is the call graph for this function:
Here is the caller graph for this function:

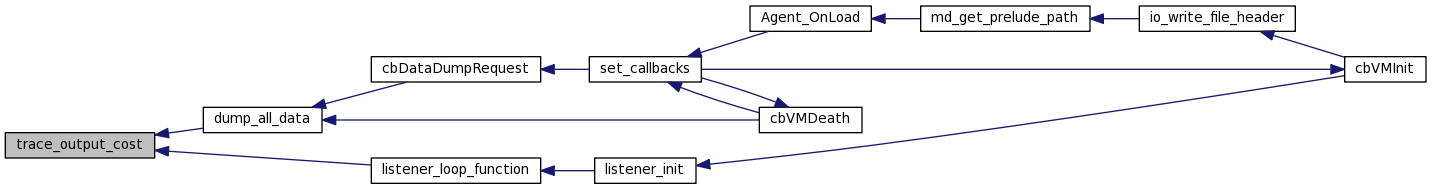
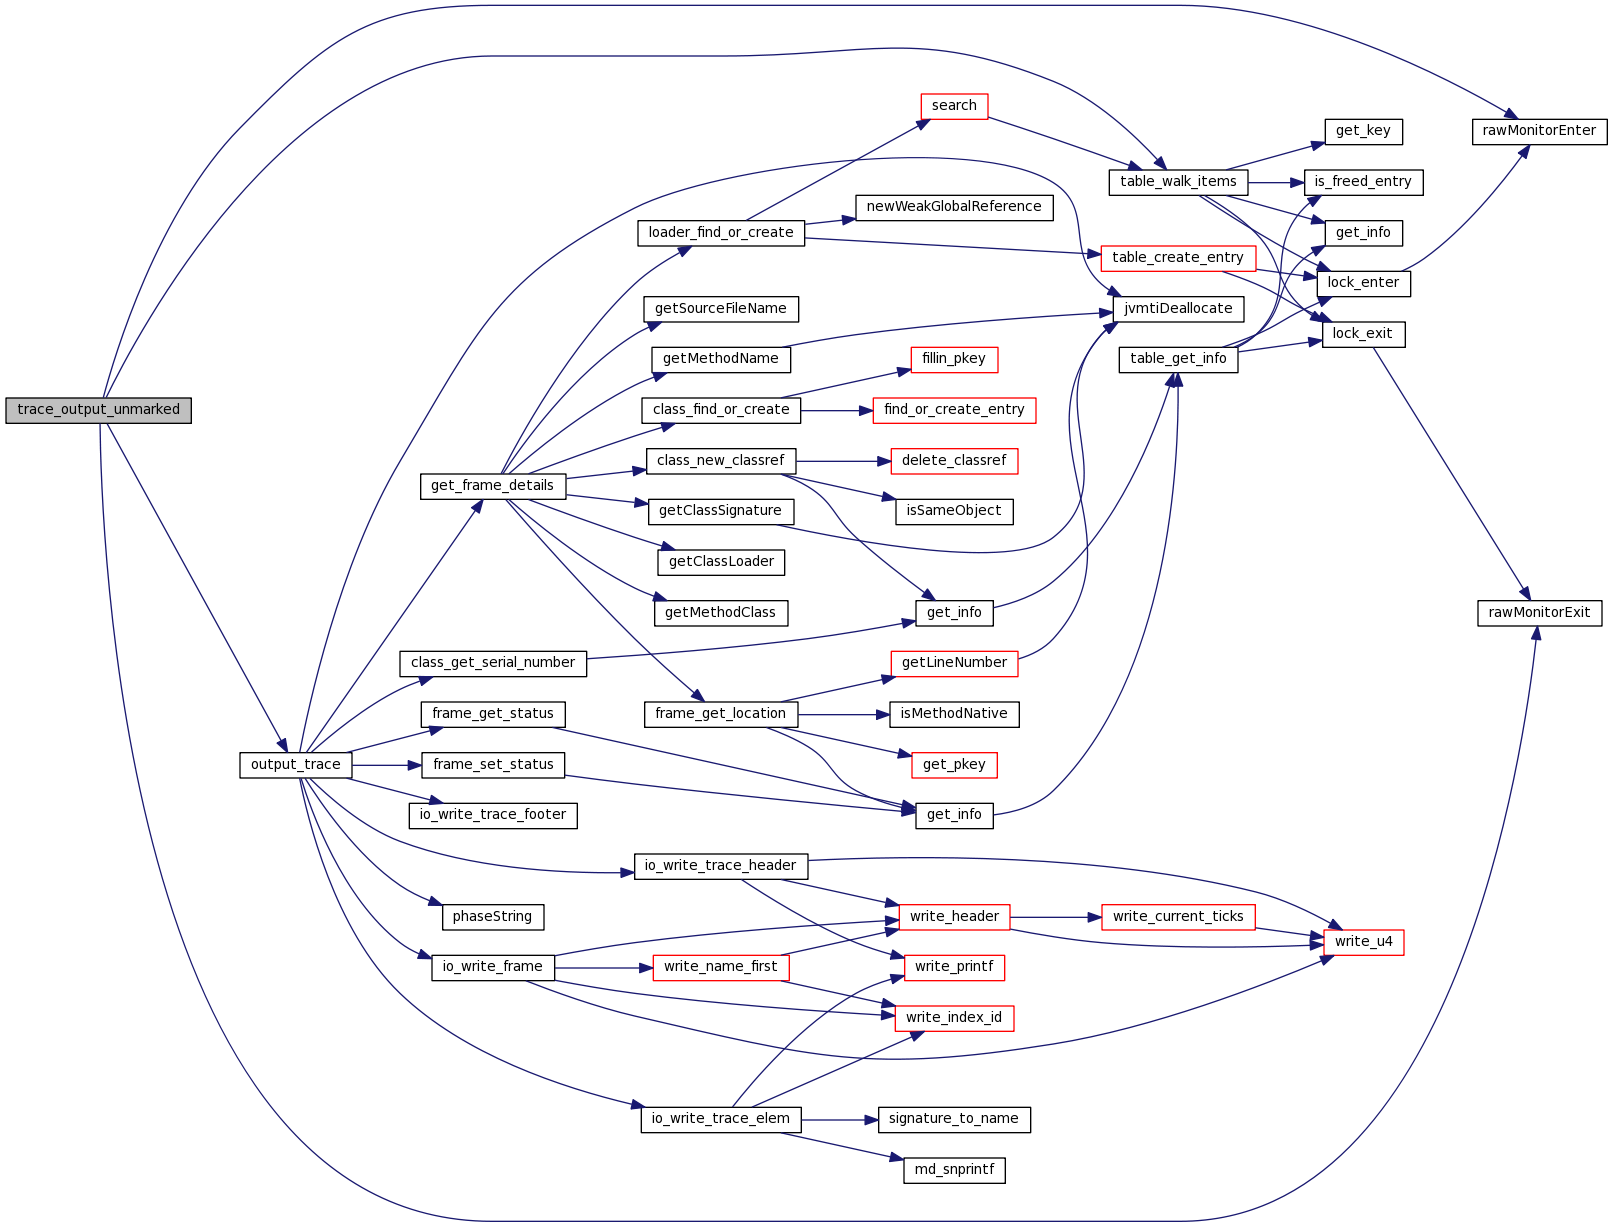
| void trace_output_unmarked | ( | JNIEnv * | env | ) |
Definition at line 675 of file hprof_trace.c.
Here is the call graph for this function:
Here is the caller graph for this function: