|
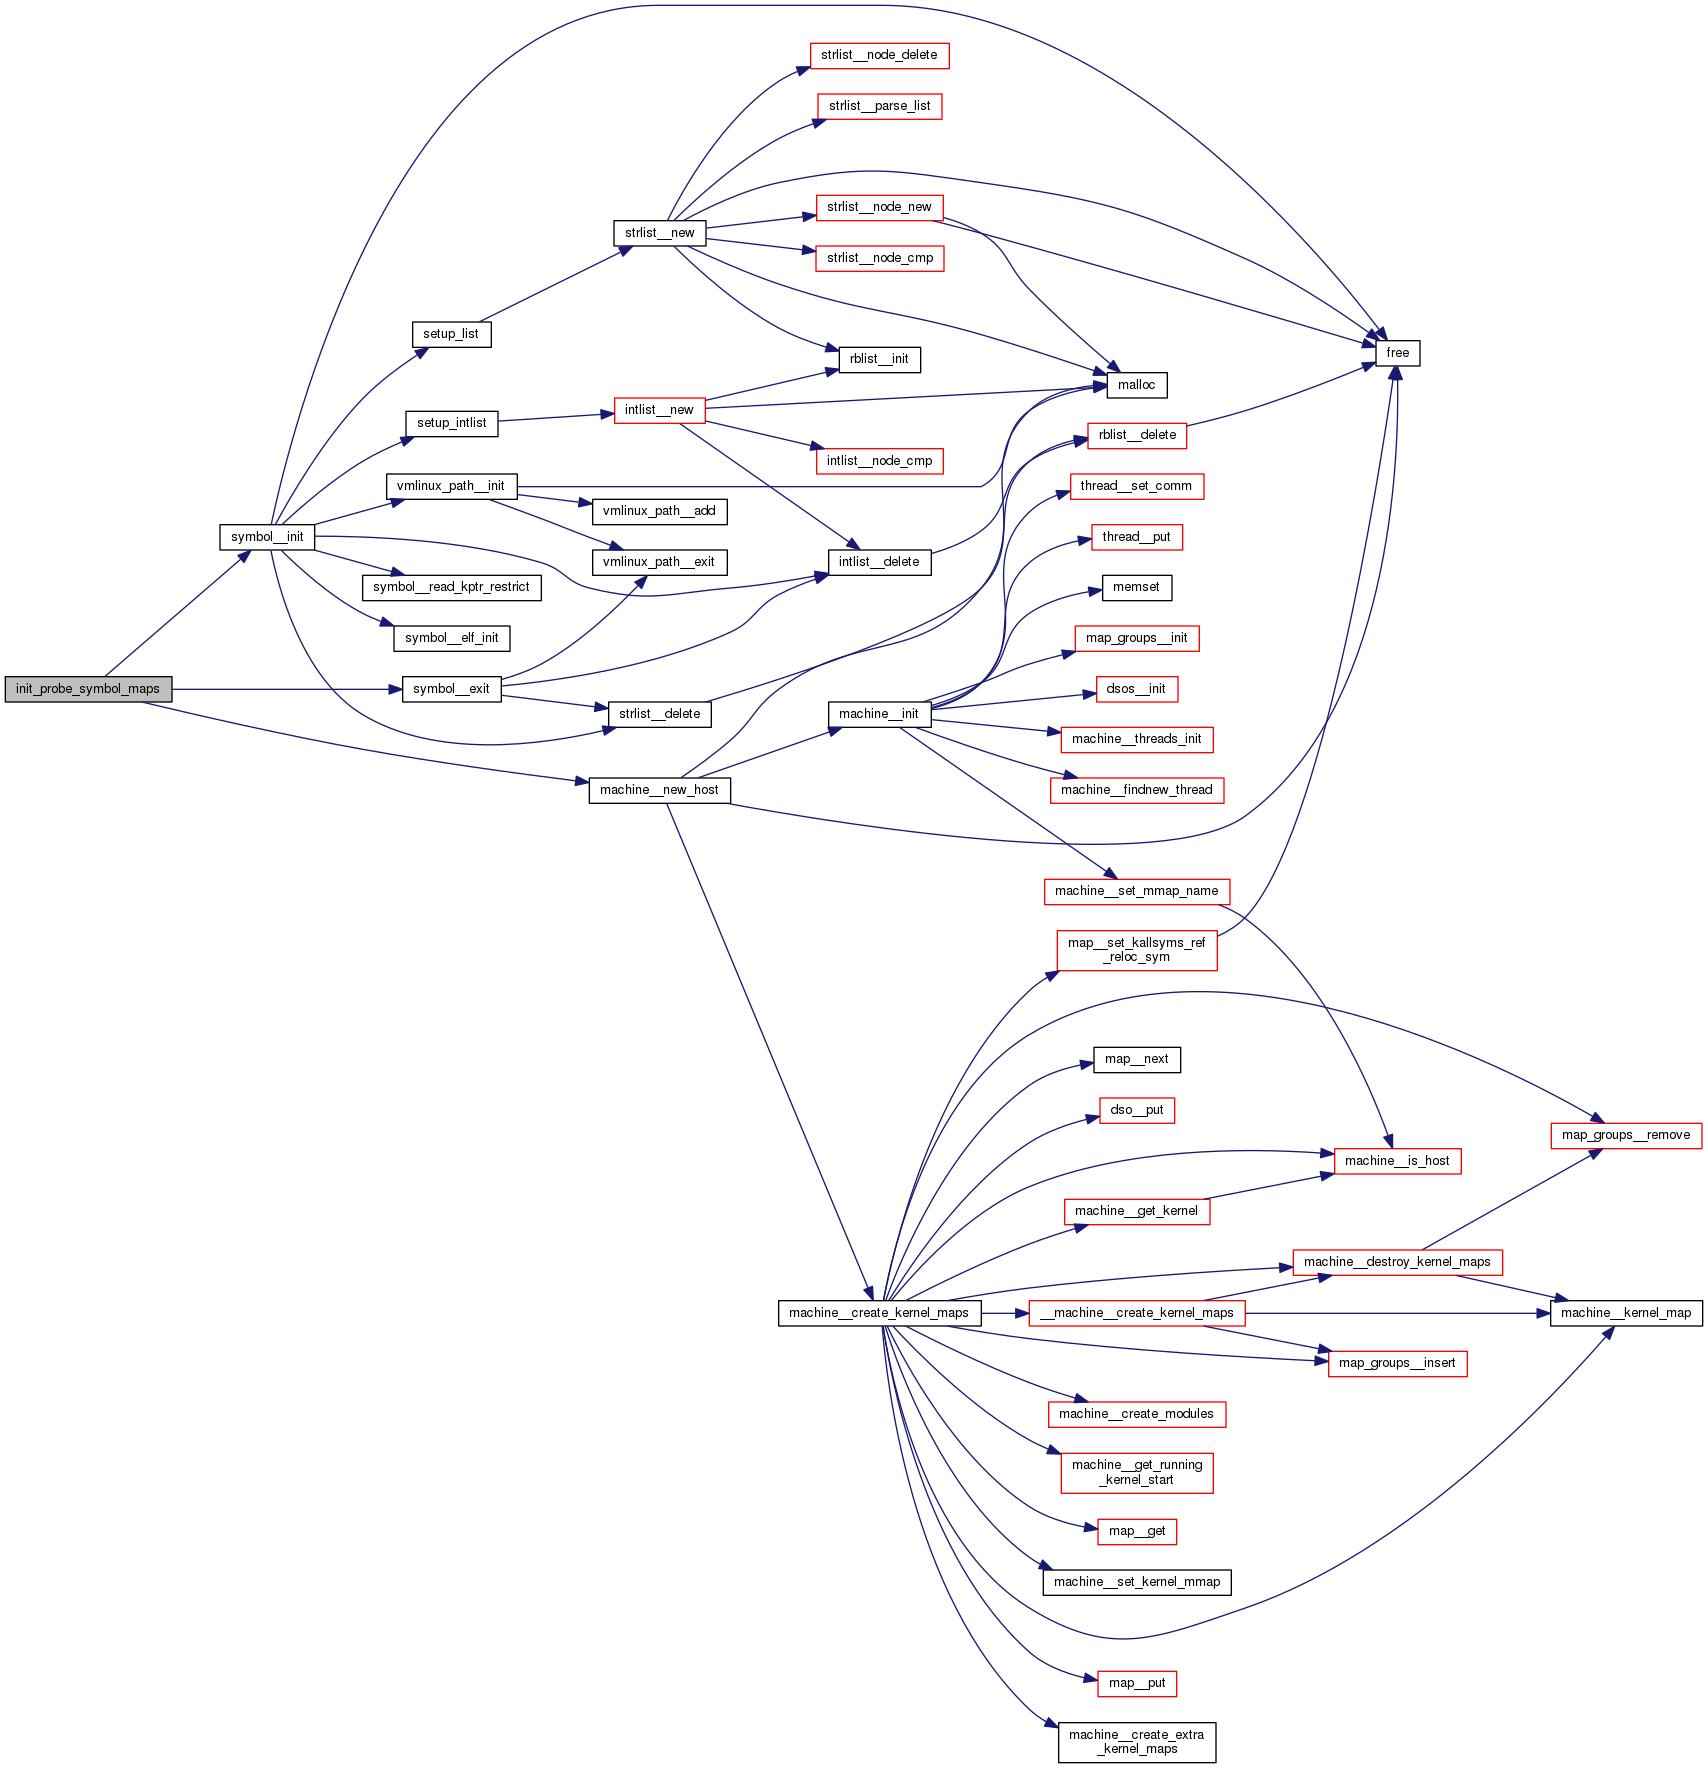
| int | init_probe_symbol_maps (bool user_only) |
| |
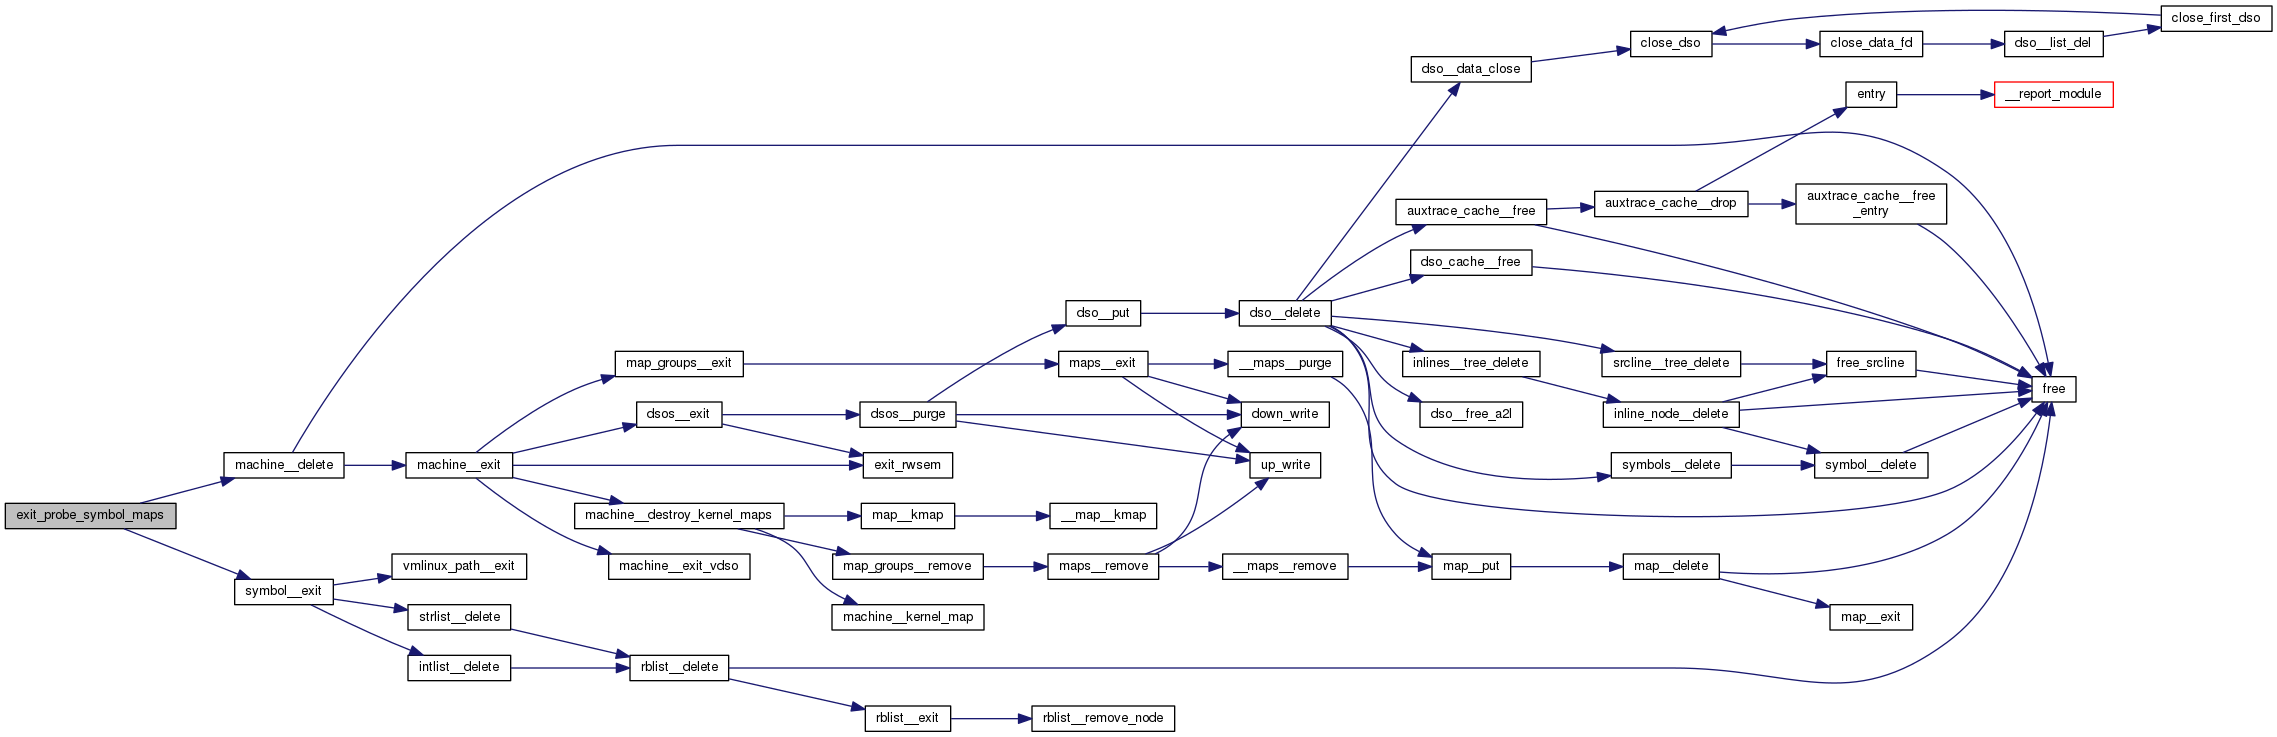
| void | exit_probe_symbol_maps (void) |
| |
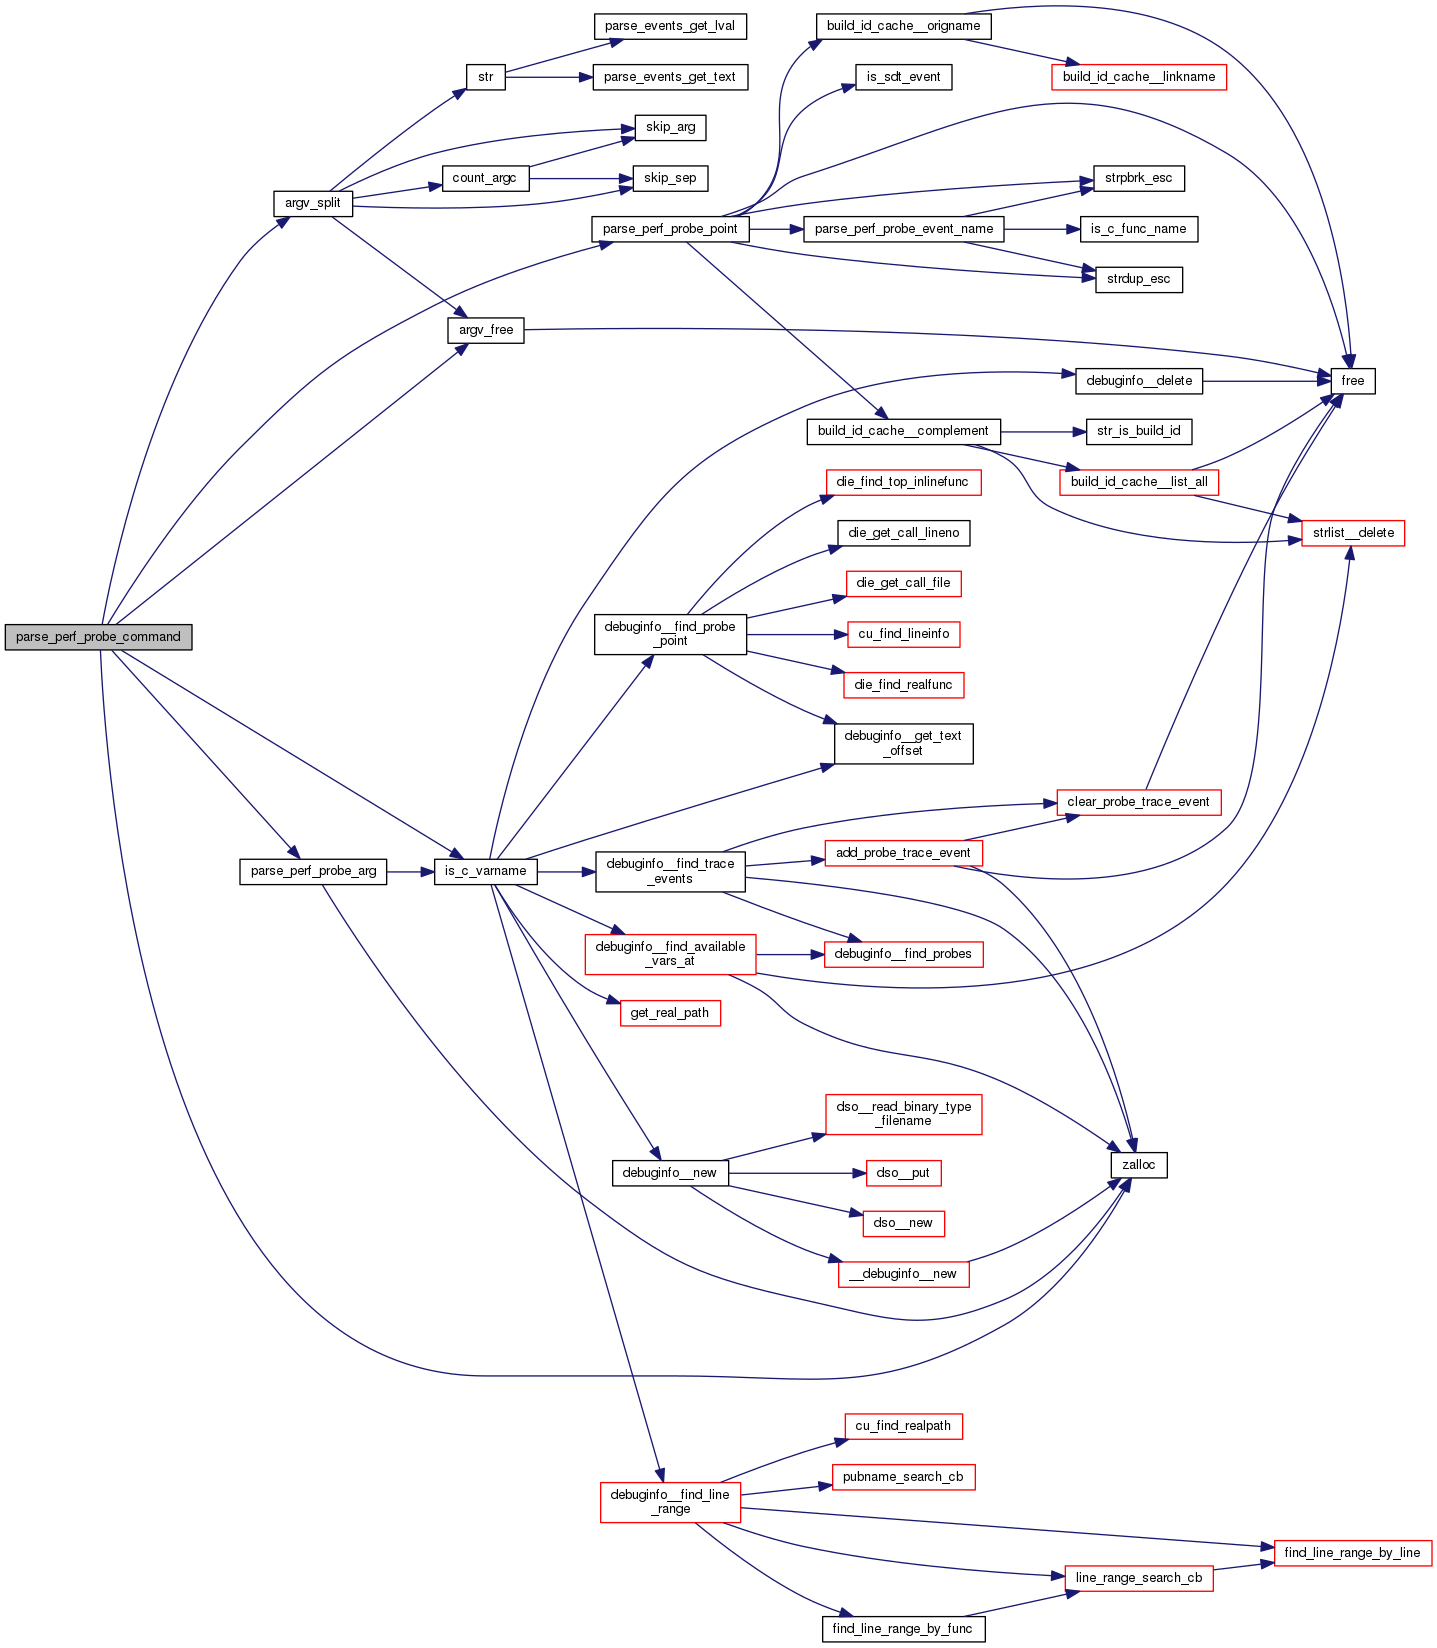
| int | parse_perf_probe_command (const char *cmd, struct perf_probe_event *pev) |
| |
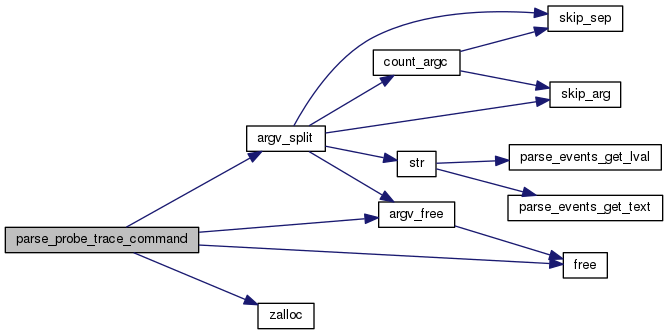
| int | parse_probe_trace_command (const char *cmd, struct probe_trace_event *tev) |
| |
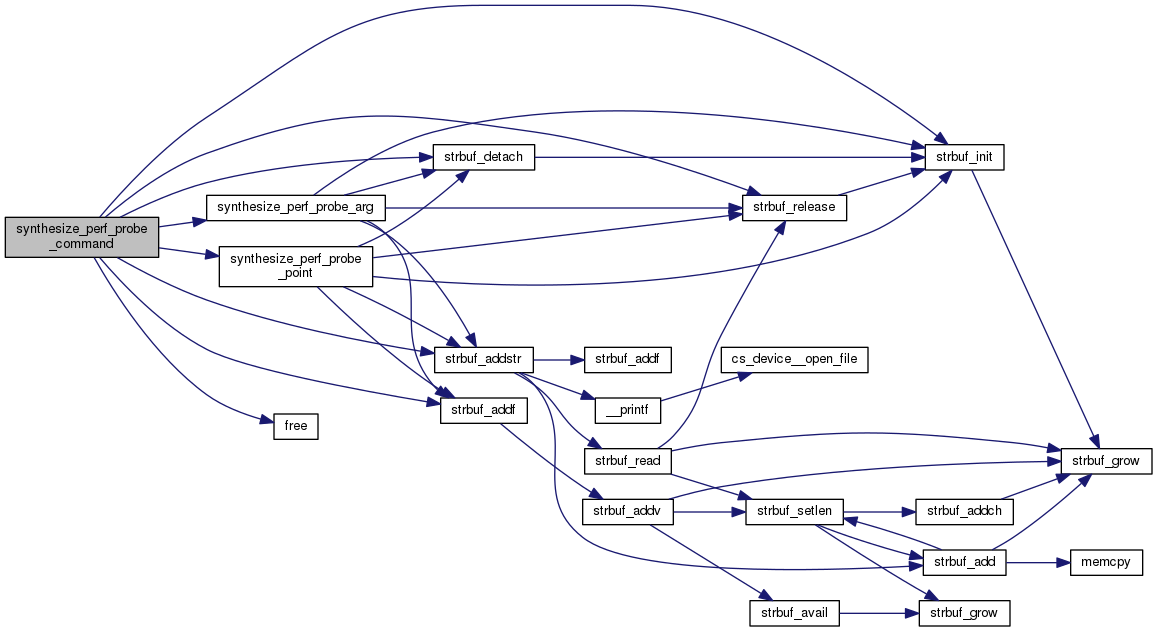
| char * | synthesize_perf_probe_command (struct perf_probe_event *pev) |
| |
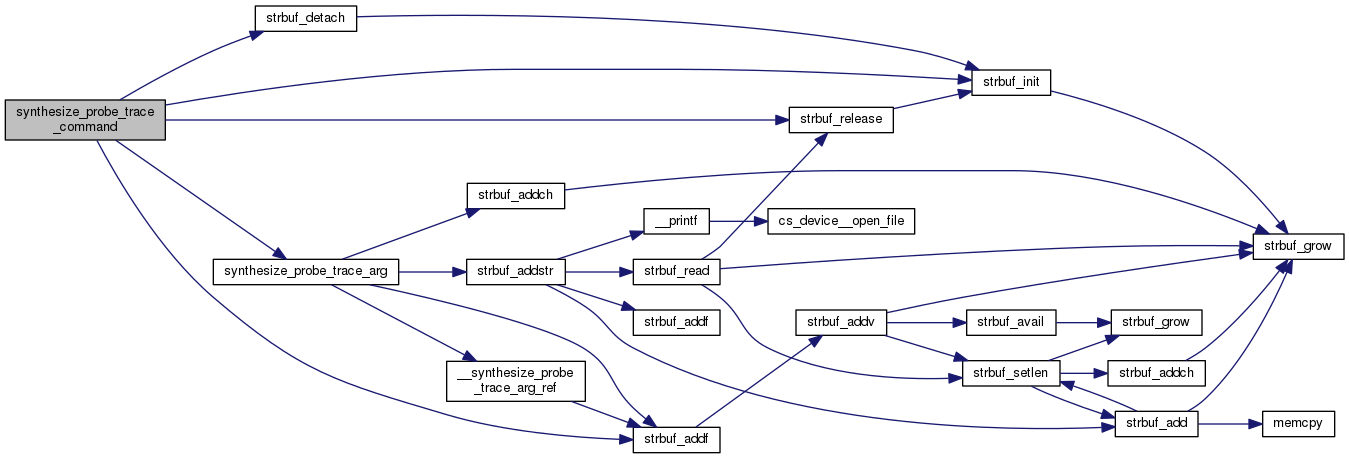
| char * | synthesize_probe_trace_command (struct probe_trace_event *tev) |
| |
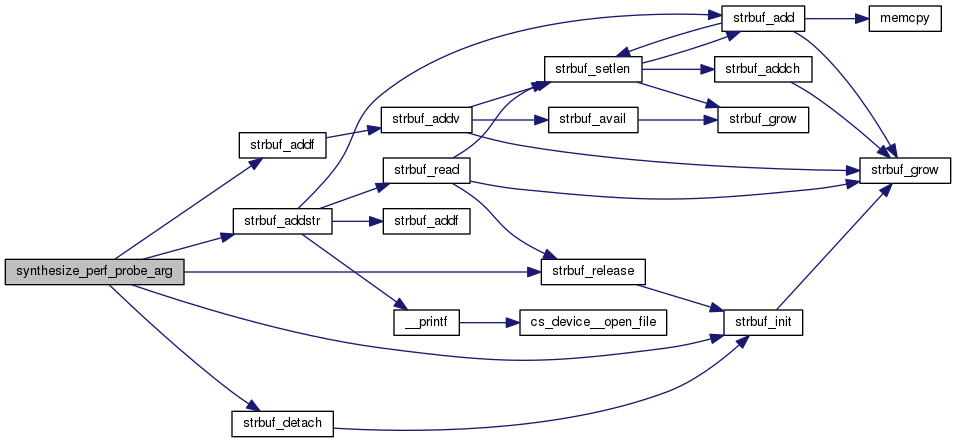
| char * | synthesize_perf_probe_arg (struct perf_probe_arg *pa) |
| |
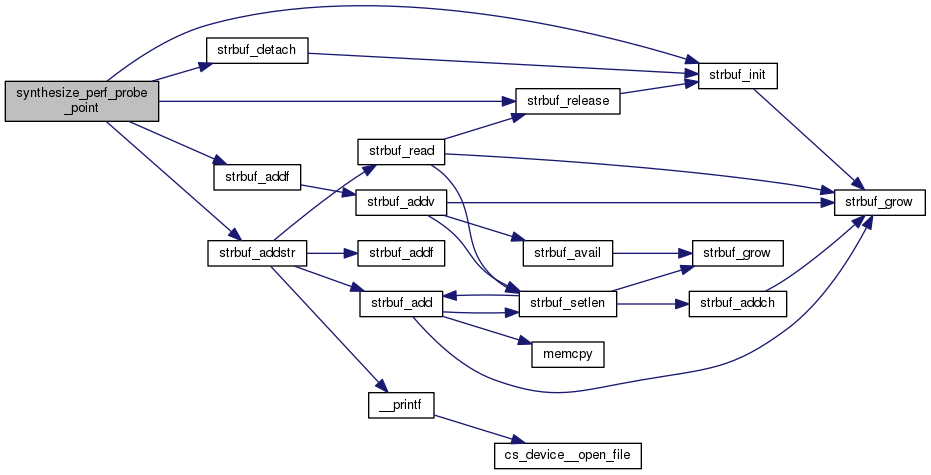
| char * | synthesize_perf_probe_point (struct perf_probe_point *pp) |
| |
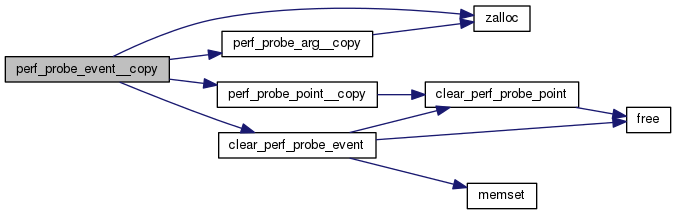
| int | perf_probe_event__copy (struct perf_probe_event *dst, struct perf_probe_event *src) |
| |
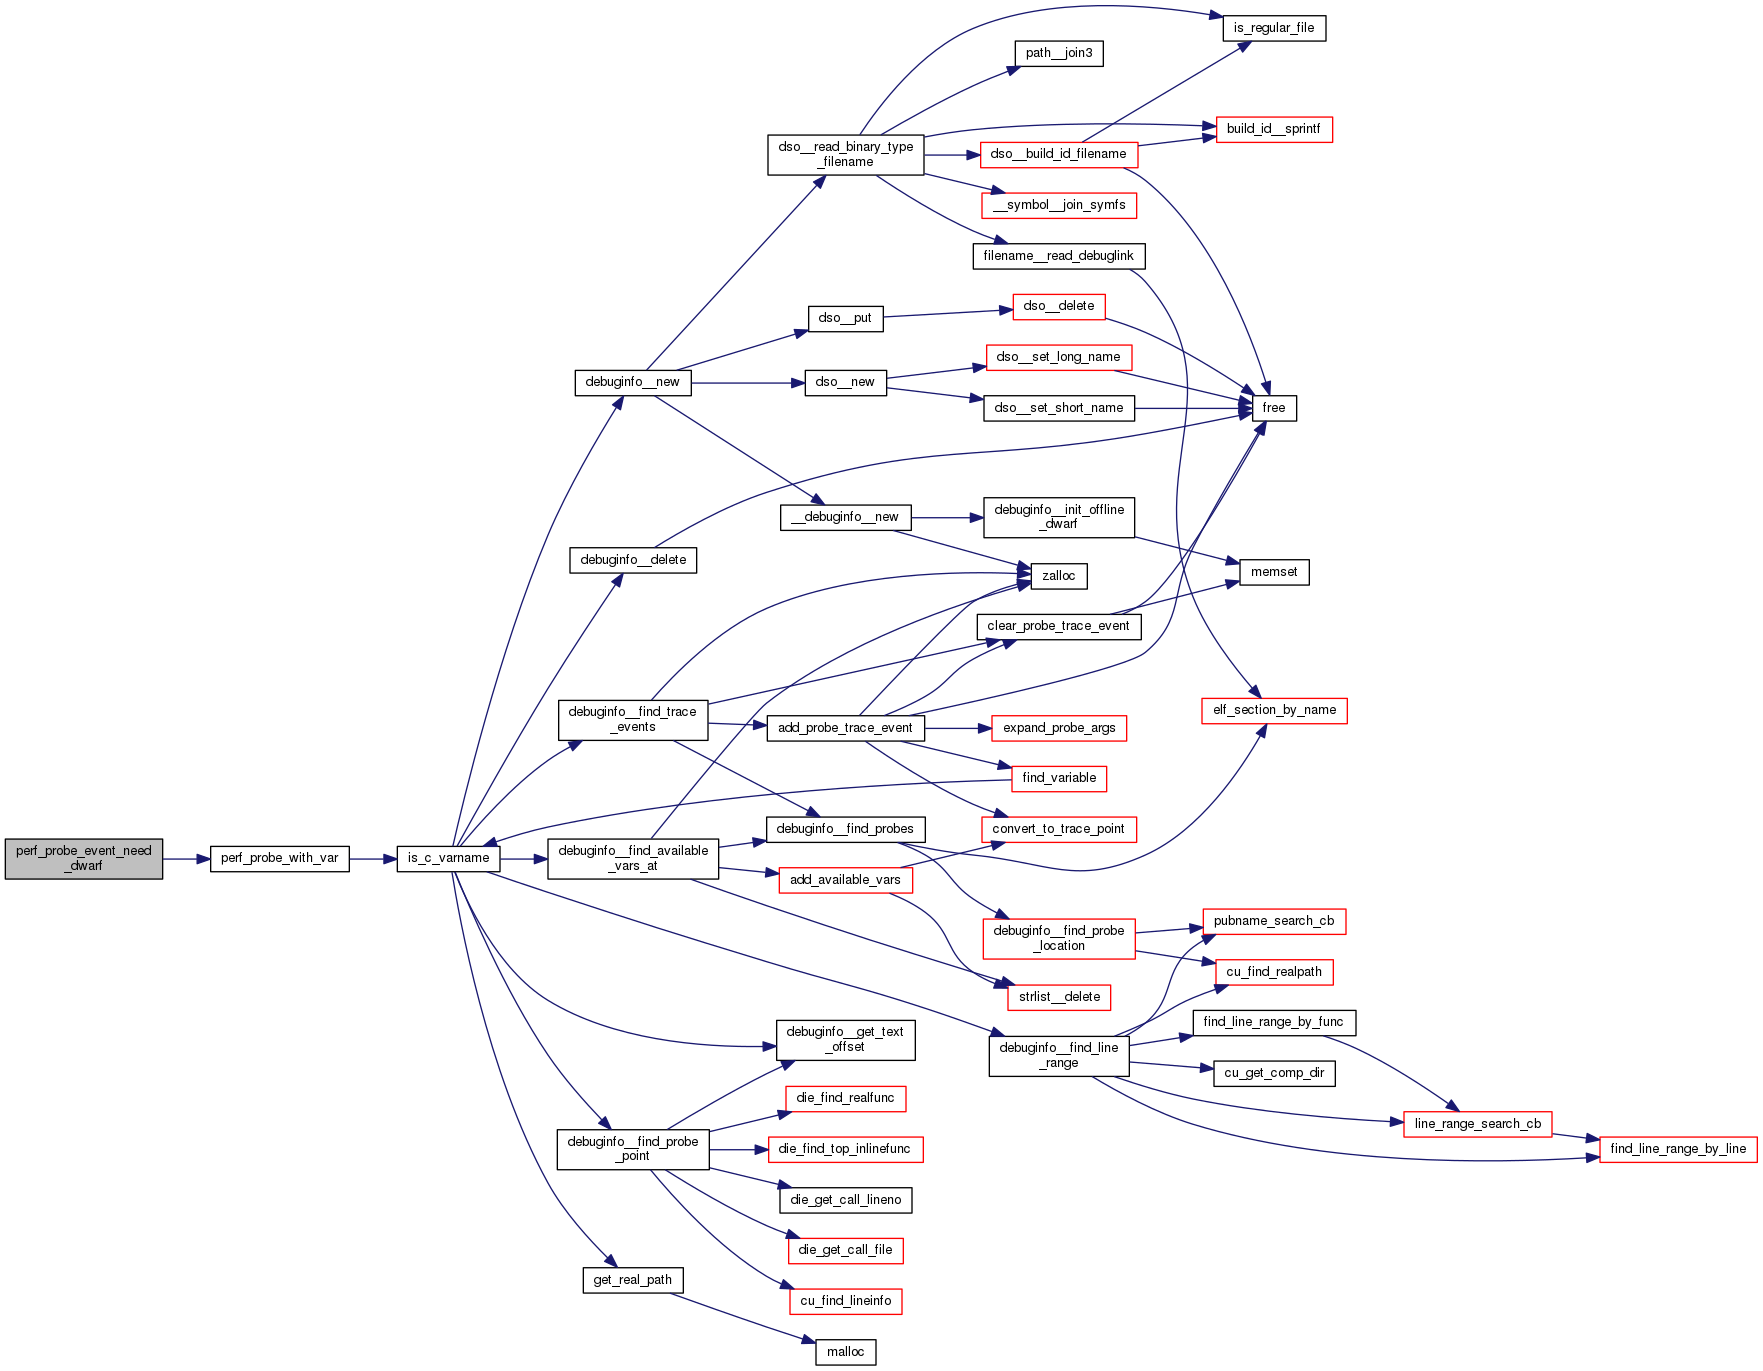
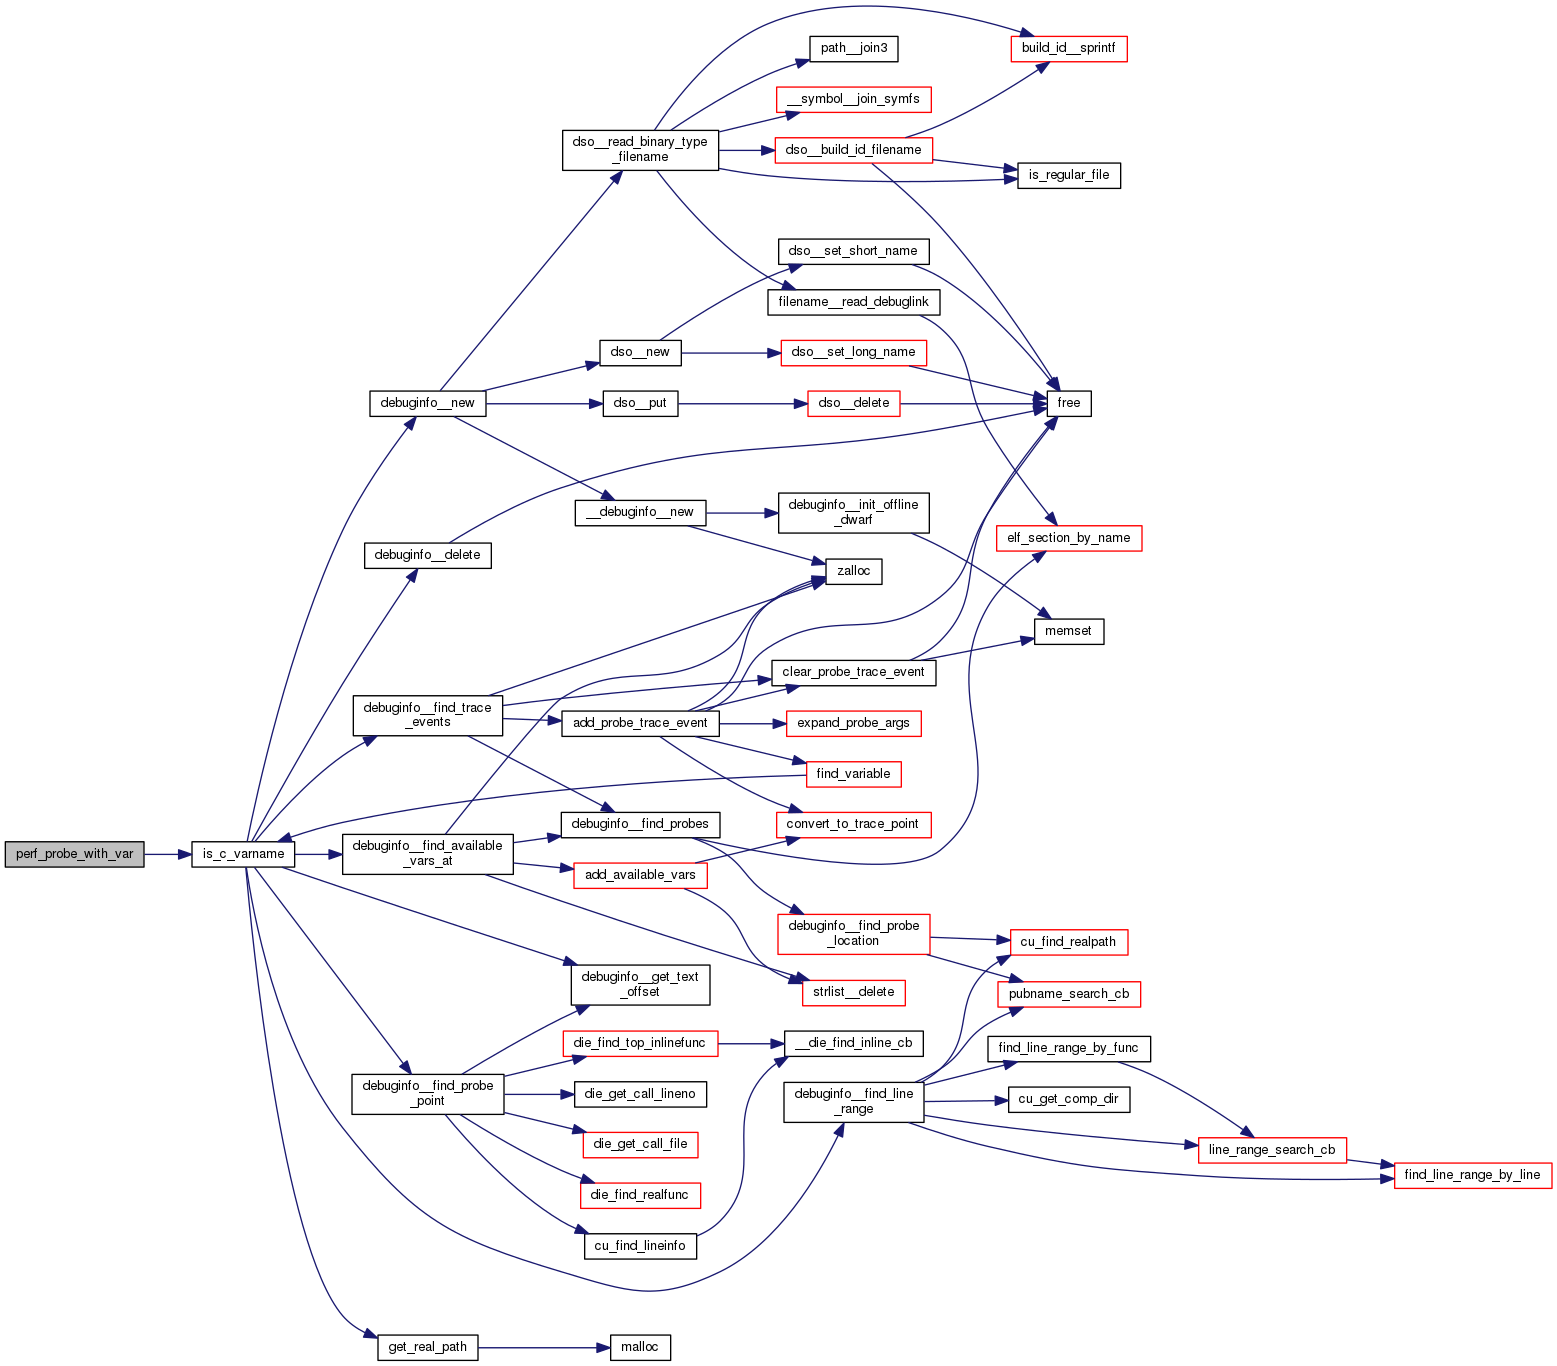
| bool | perf_probe_with_var (struct perf_probe_event *pev) |
| |
| bool | perf_probe_event_need_dwarf (struct perf_probe_event *pev) |
| |
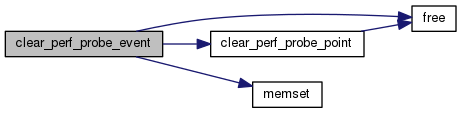
| void | clear_perf_probe_event (struct perf_probe_event *pev) |
| |
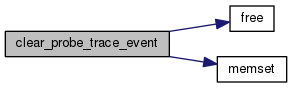
| void | clear_probe_trace_event (struct probe_trace_event *tev) |
| |
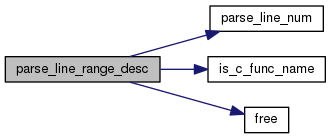
| int | parse_line_range_desc (const char *cmd, struct line_range *lr) |
| |
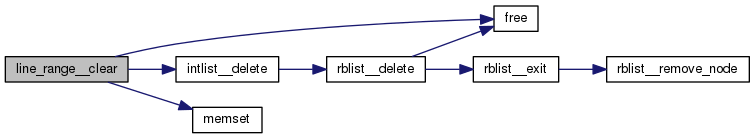
| void | line_range__clear (struct line_range *lr) |
| |
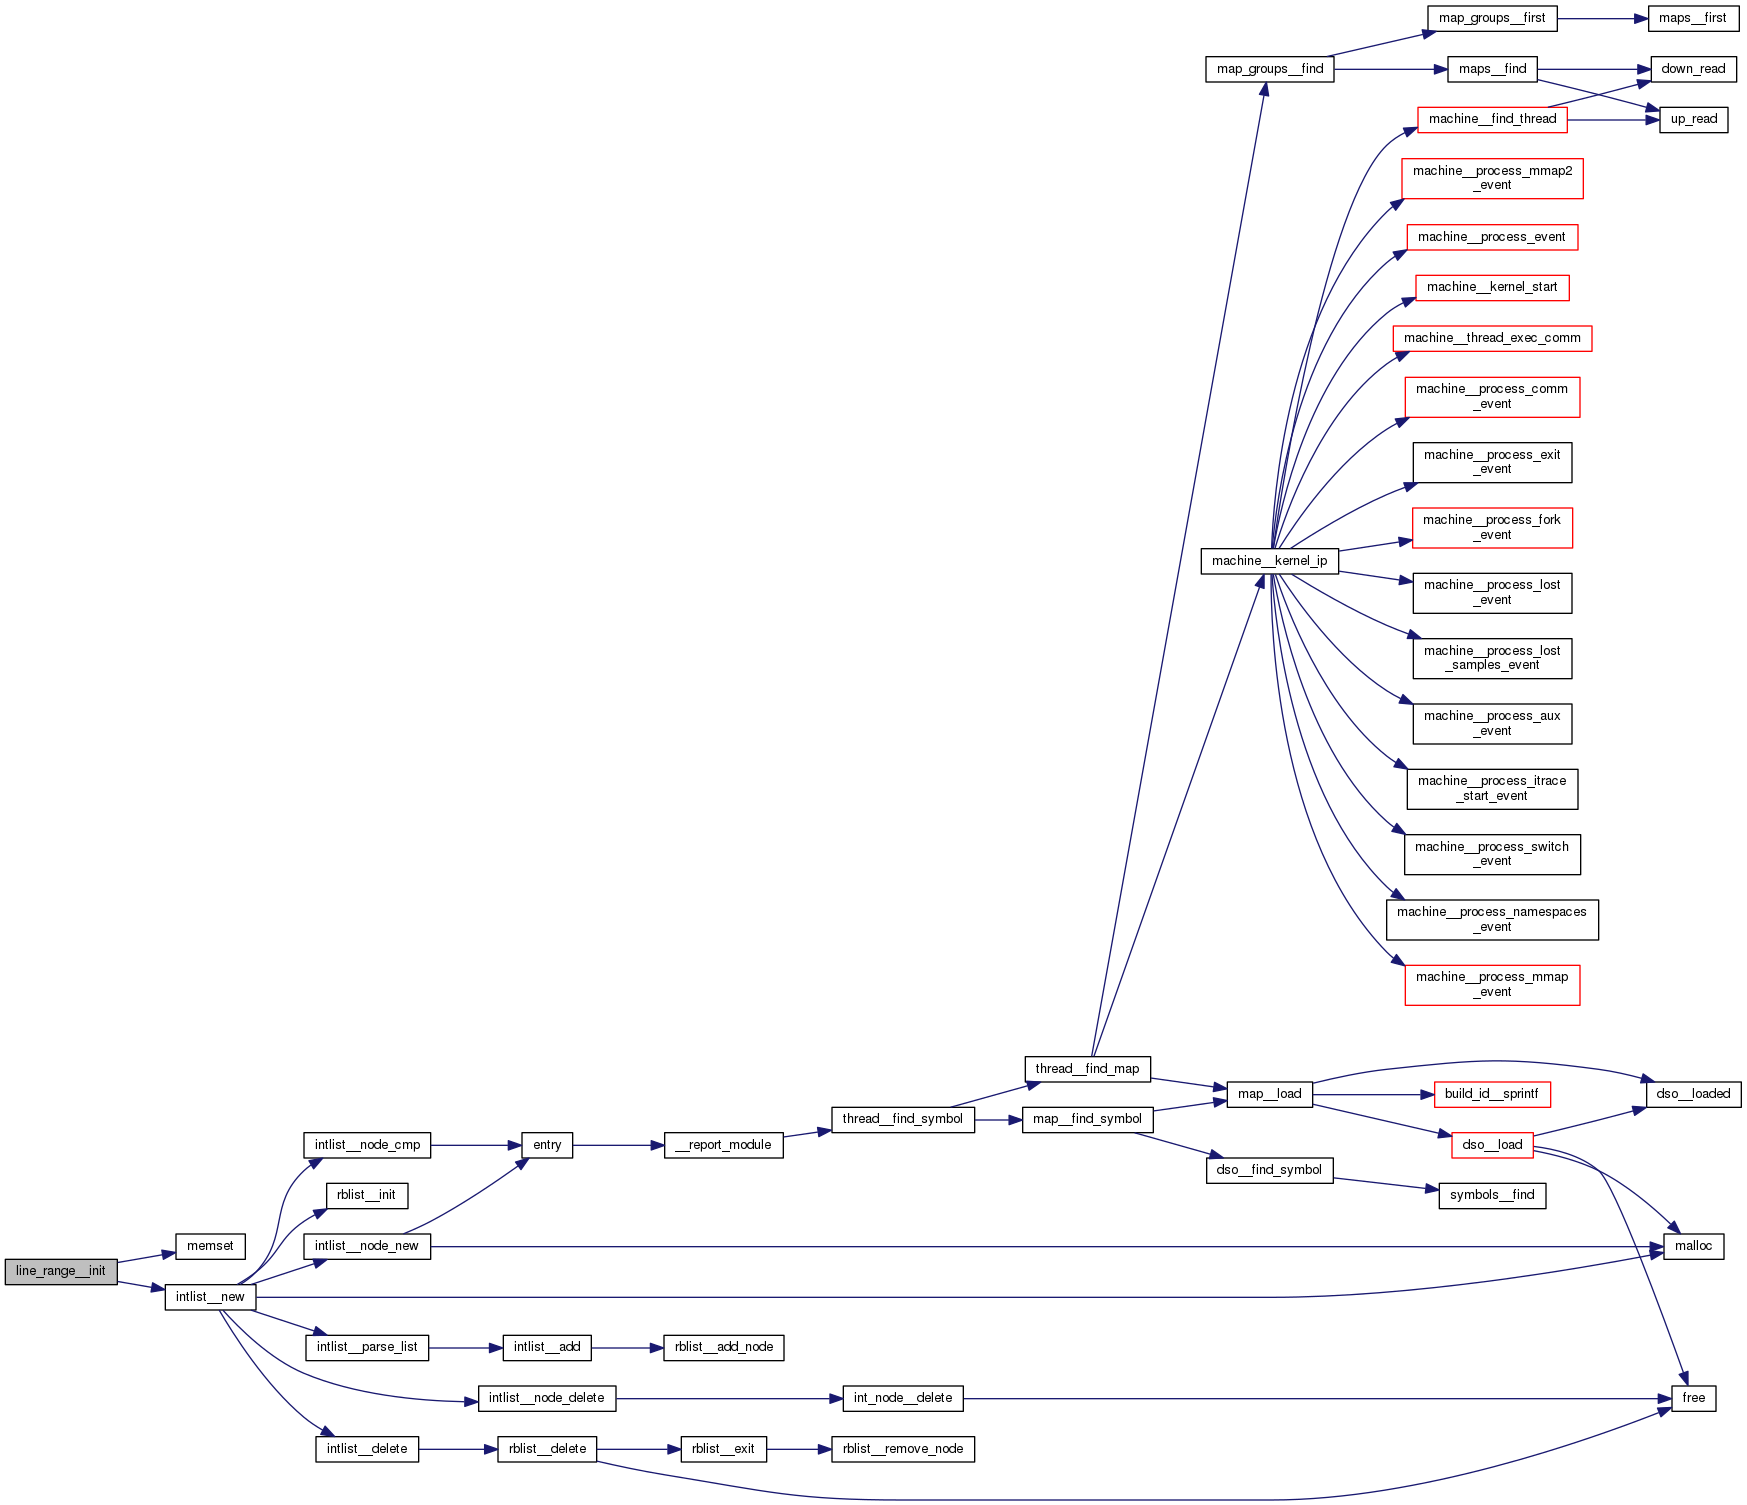
| int | line_range__init (struct line_range *lr) |
| |
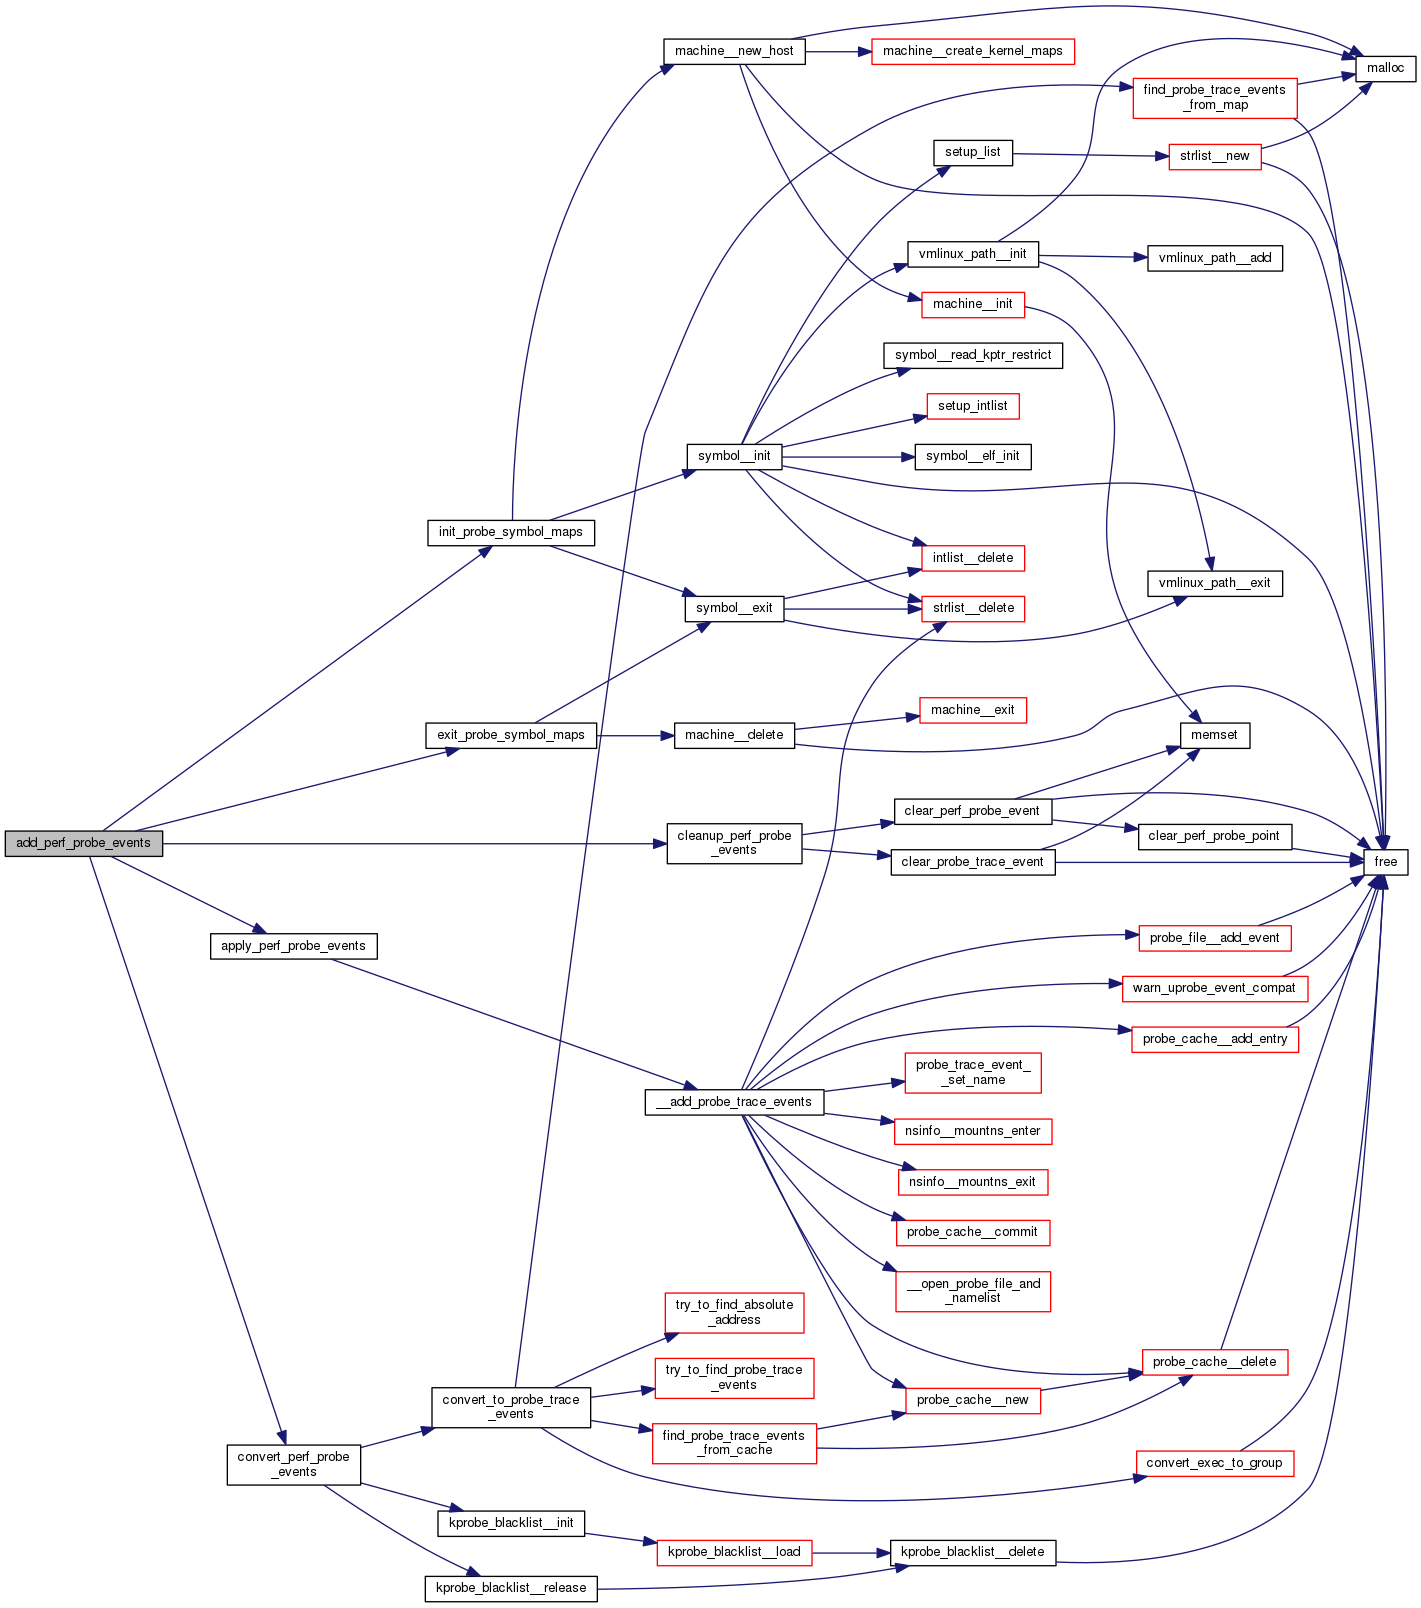
| int | add_perf_probe_events (struct perf_probe_event *pevs, int npevs) |
| |
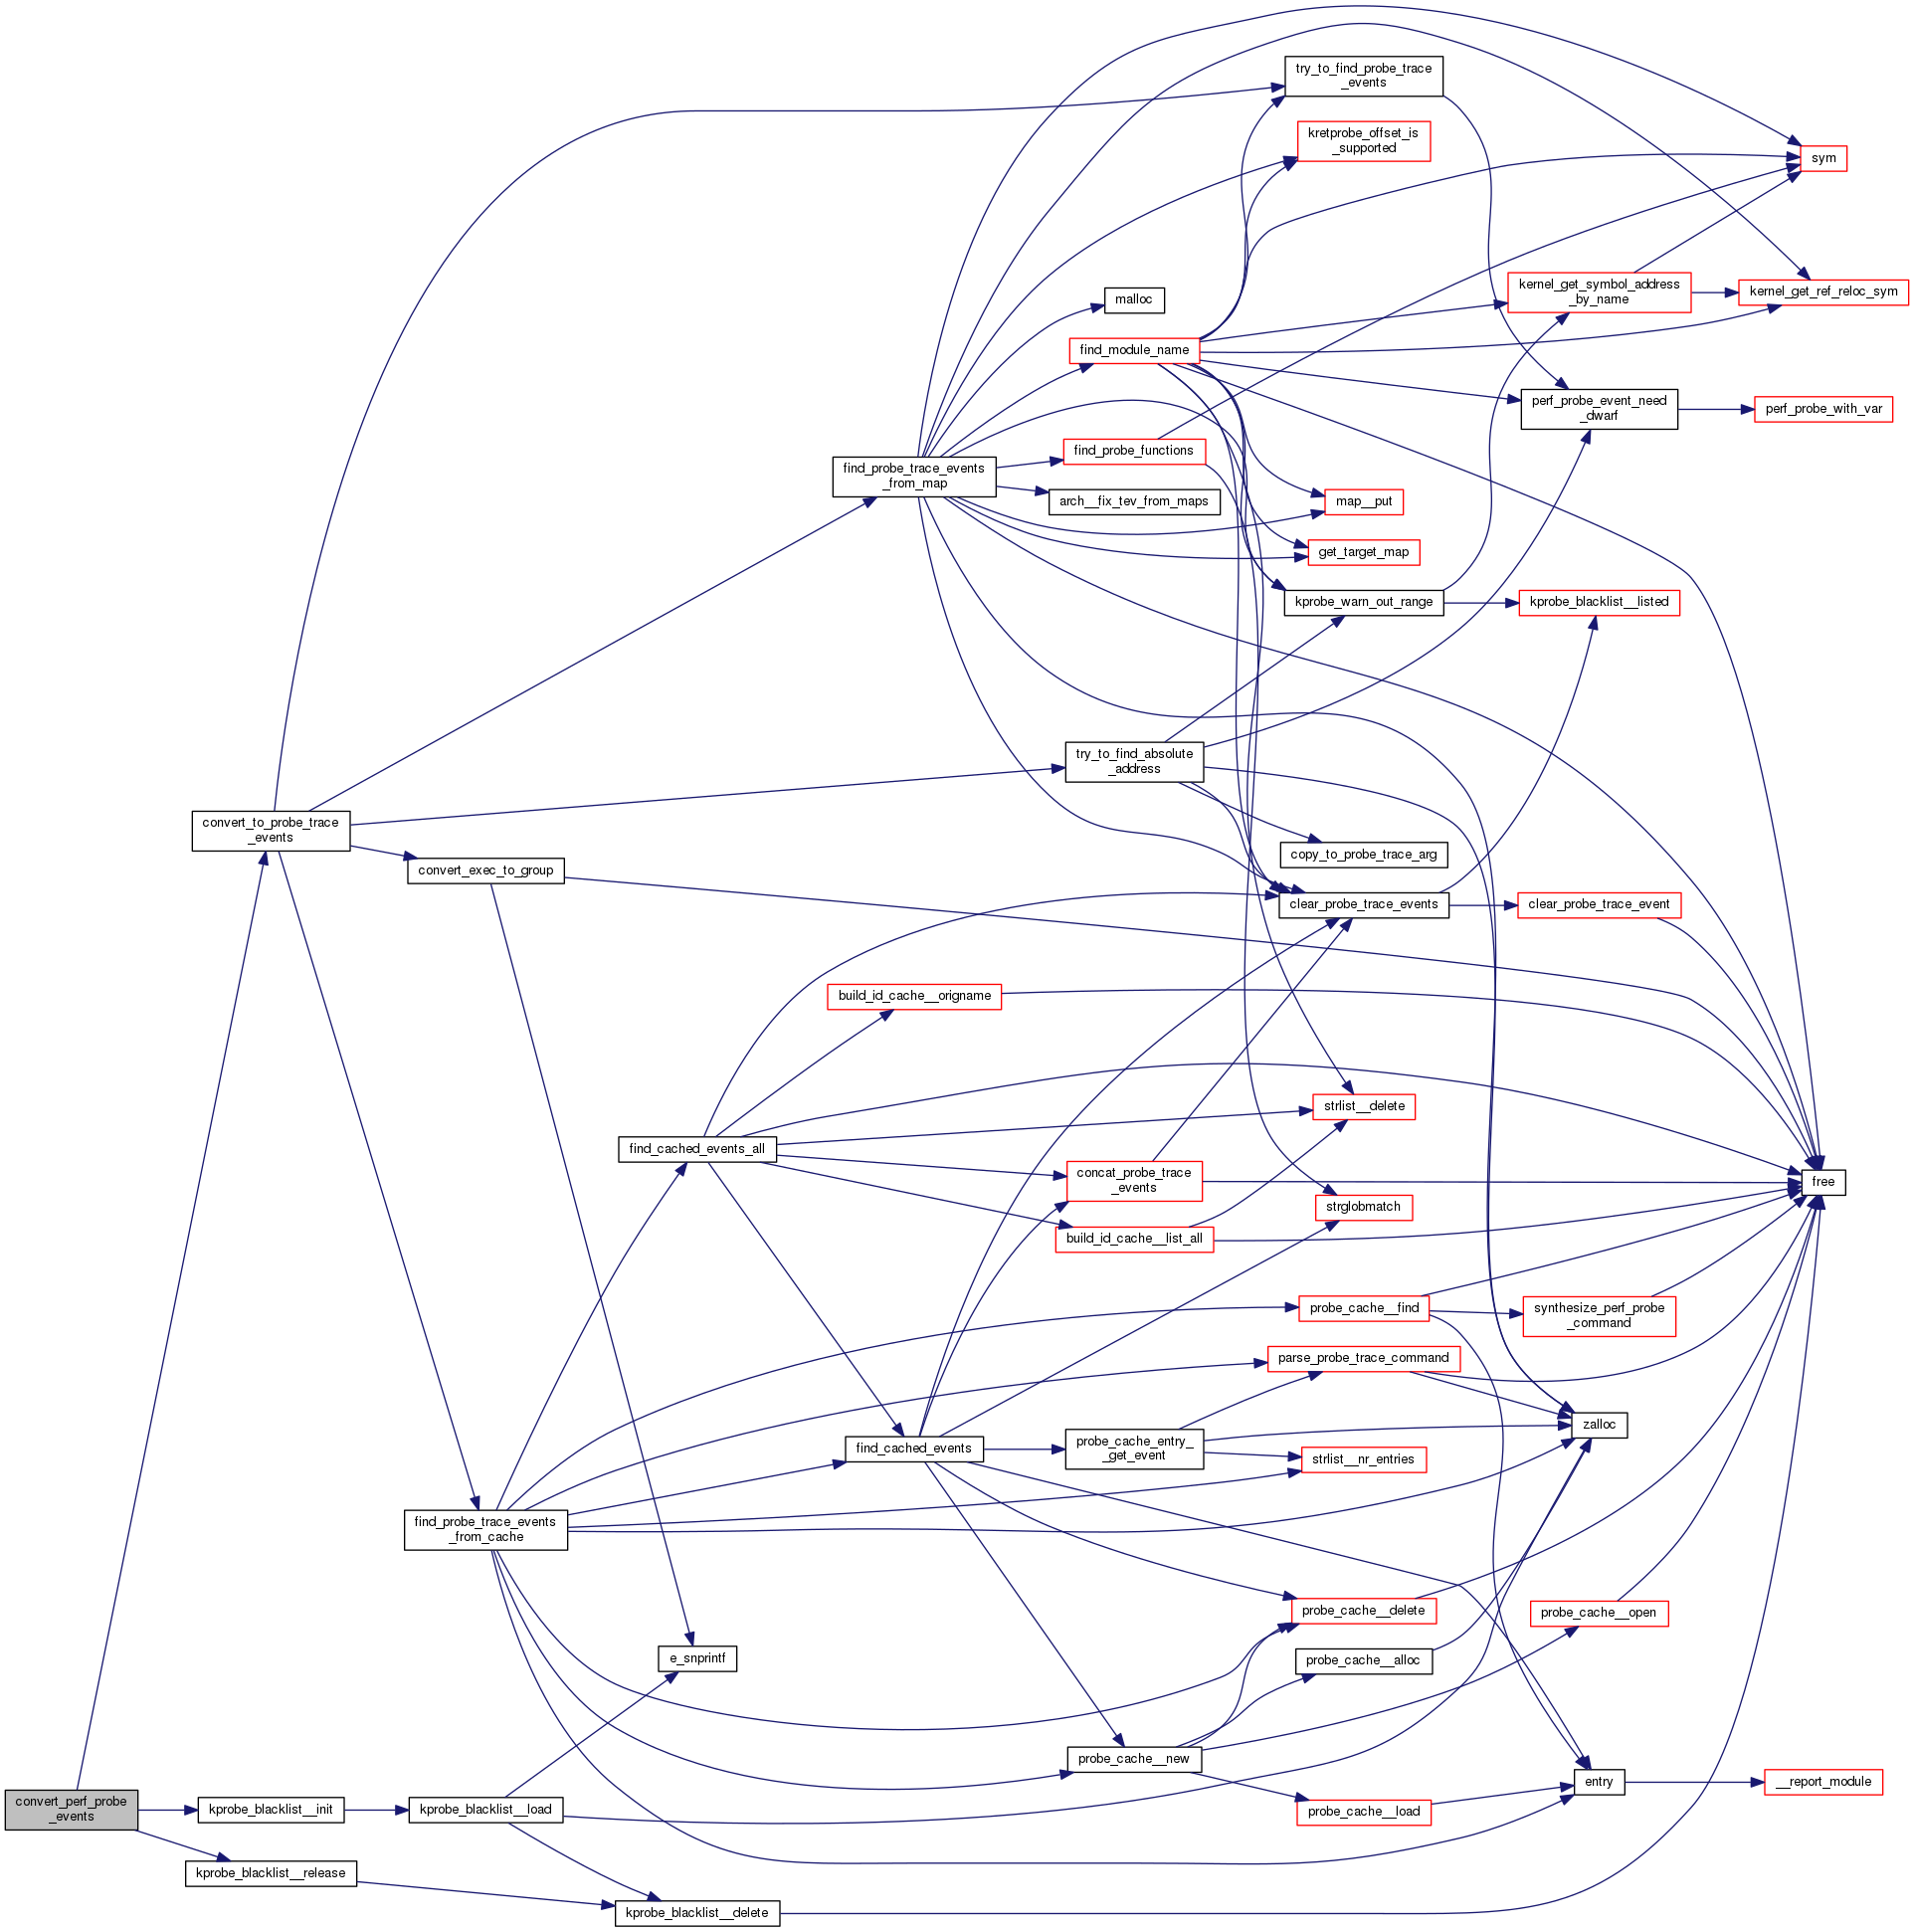
| int | convert_perf_probe_events (struct perf_probe_event *pevs, int npevs) |
| |
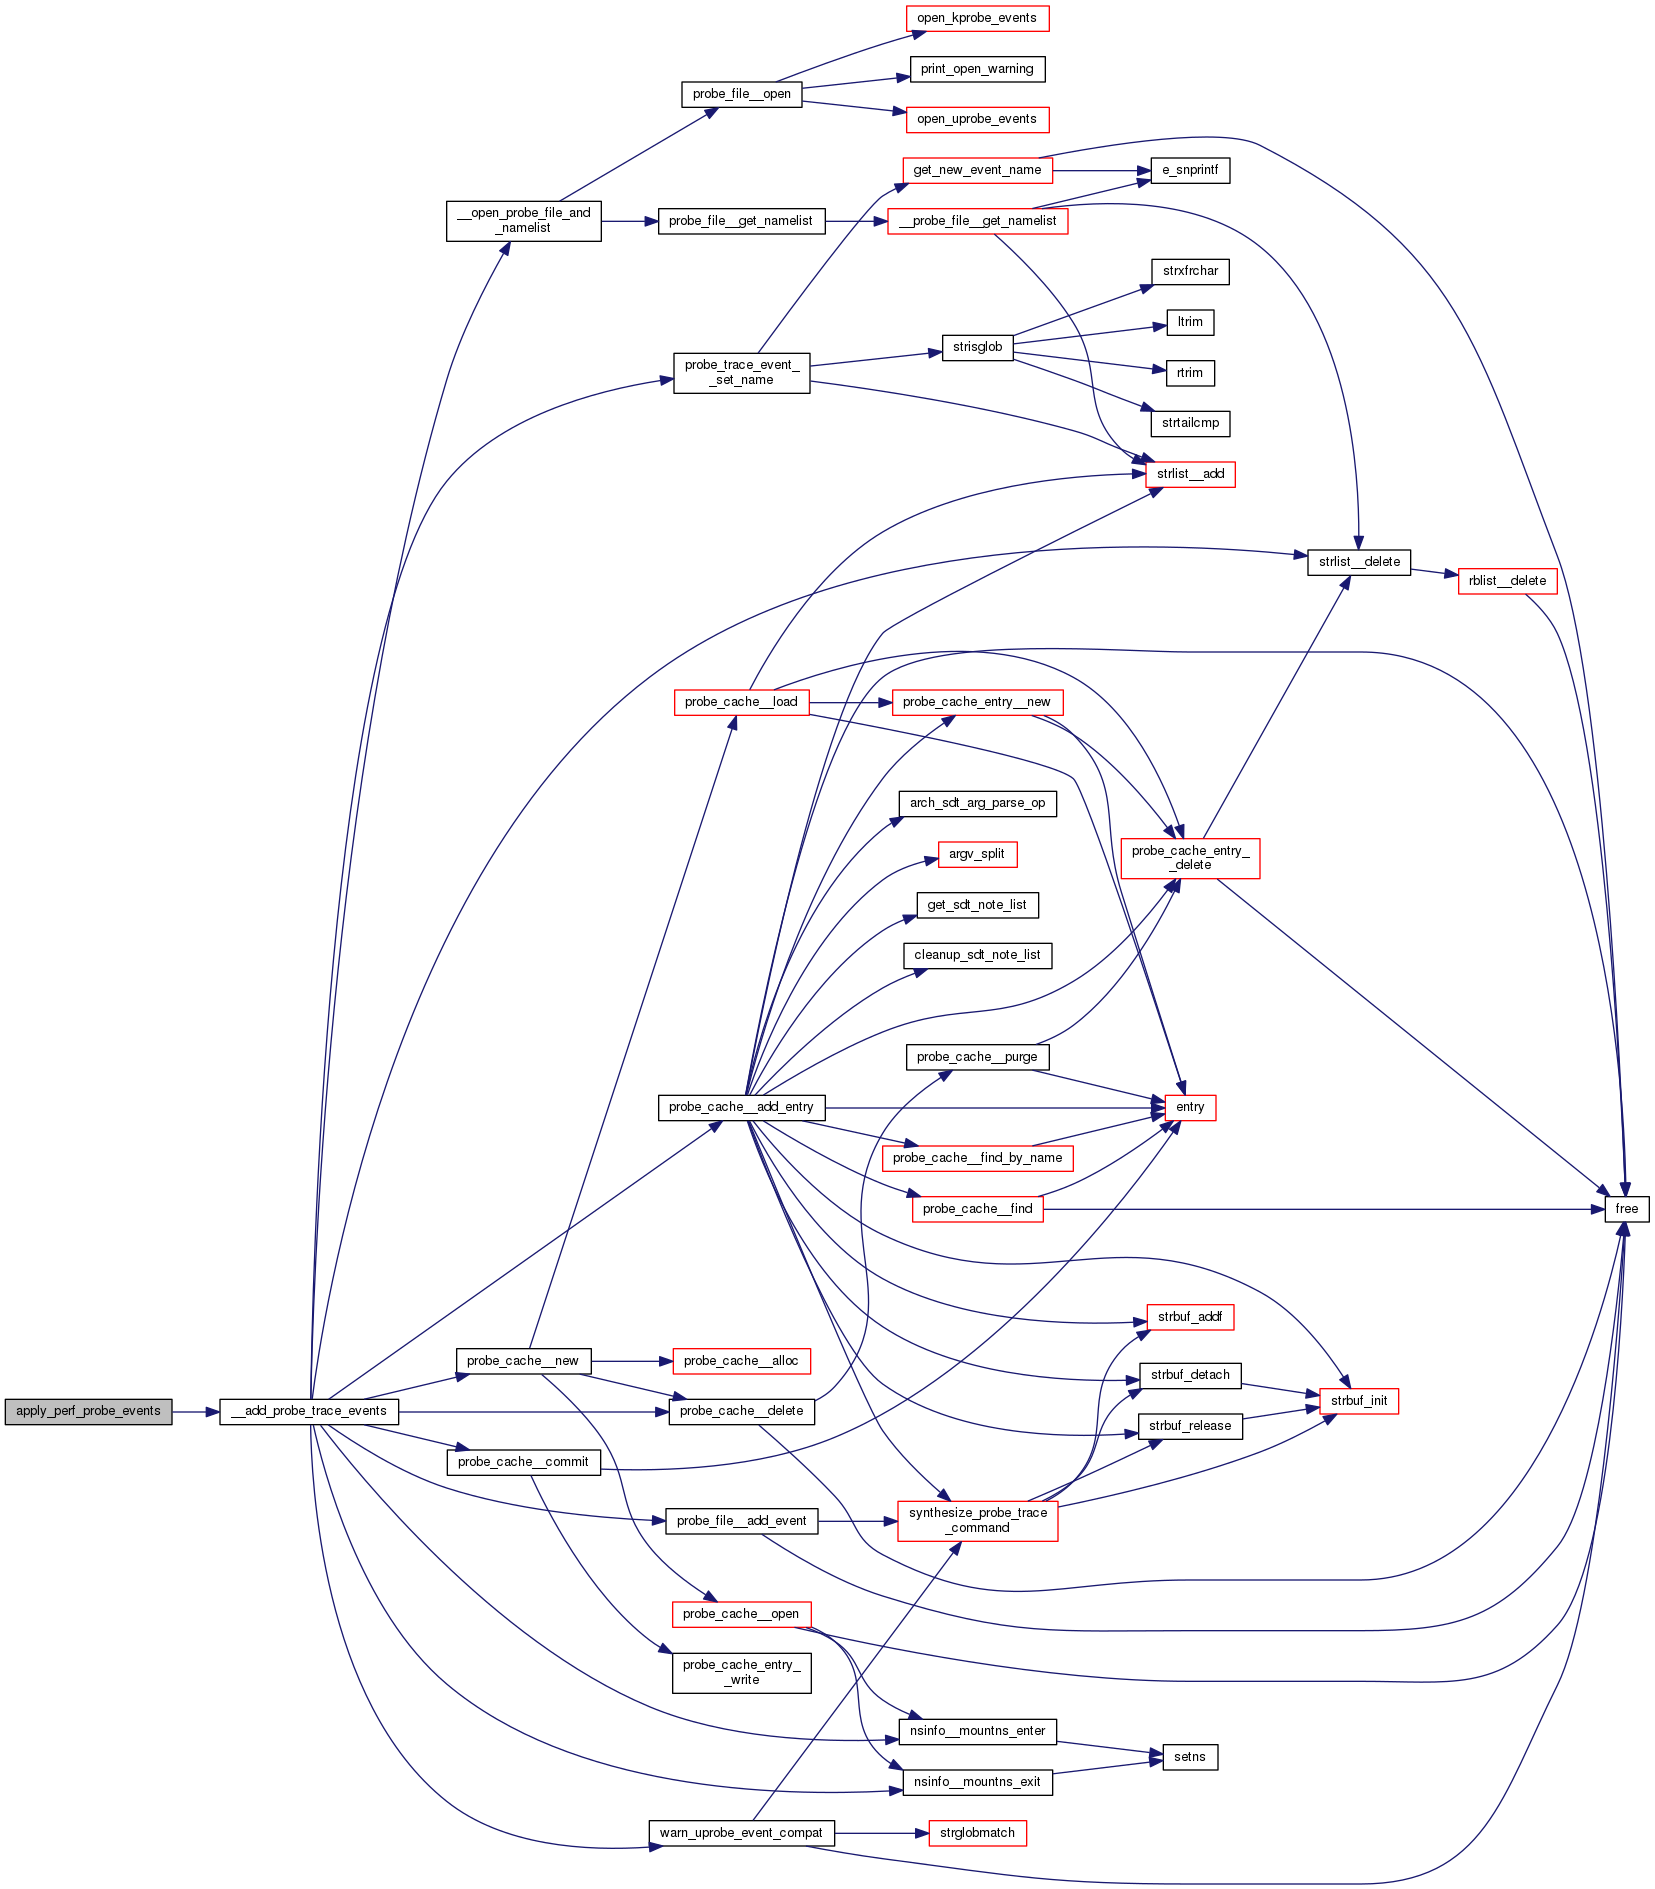
| int | apply_perf_probe_events (struct perf_probe_event *pevs, int npevs) |
| |
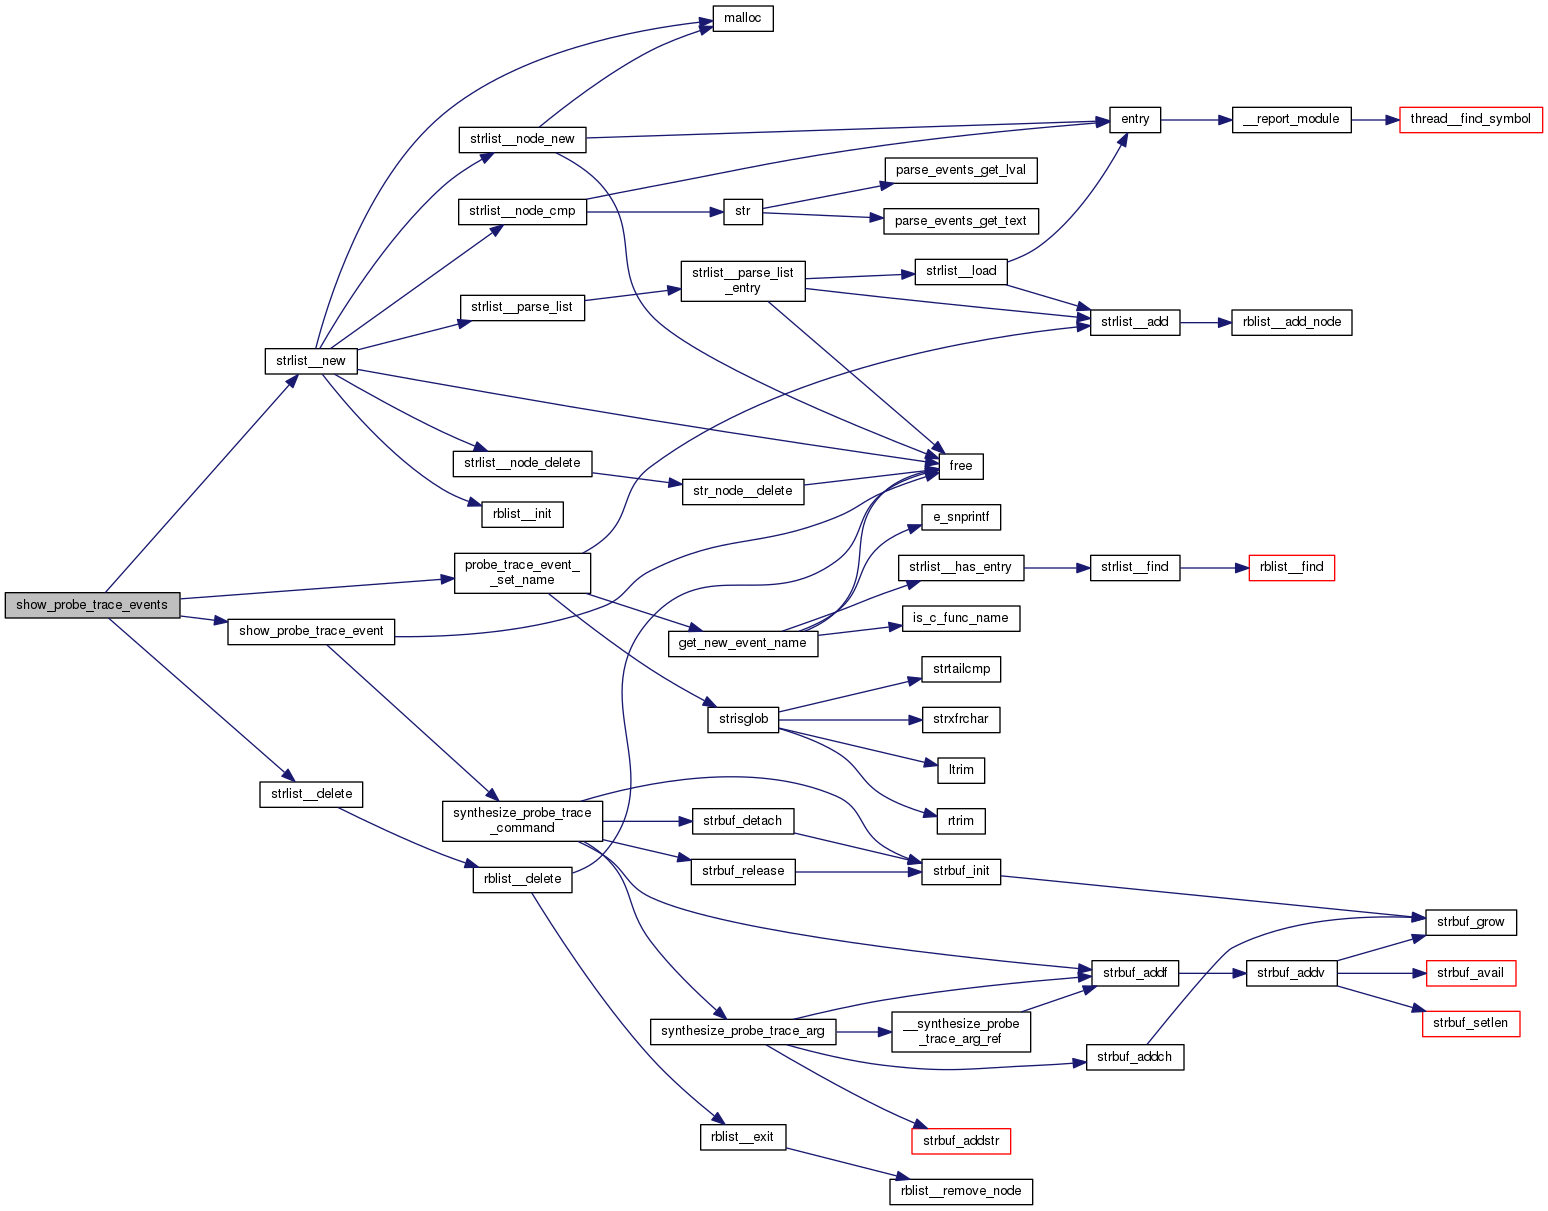
| int | show_probe_trace_events (struct perf_probe_event *pevs, int npevs) |
| |
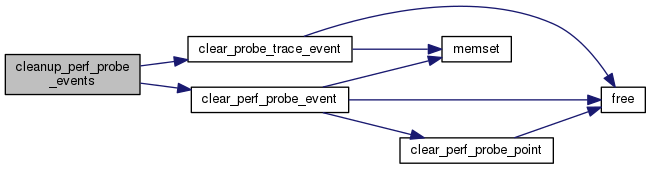
| void | cleanup_perf_probe_events (struct perf_probe_event *pevs, int npevs) |
| |
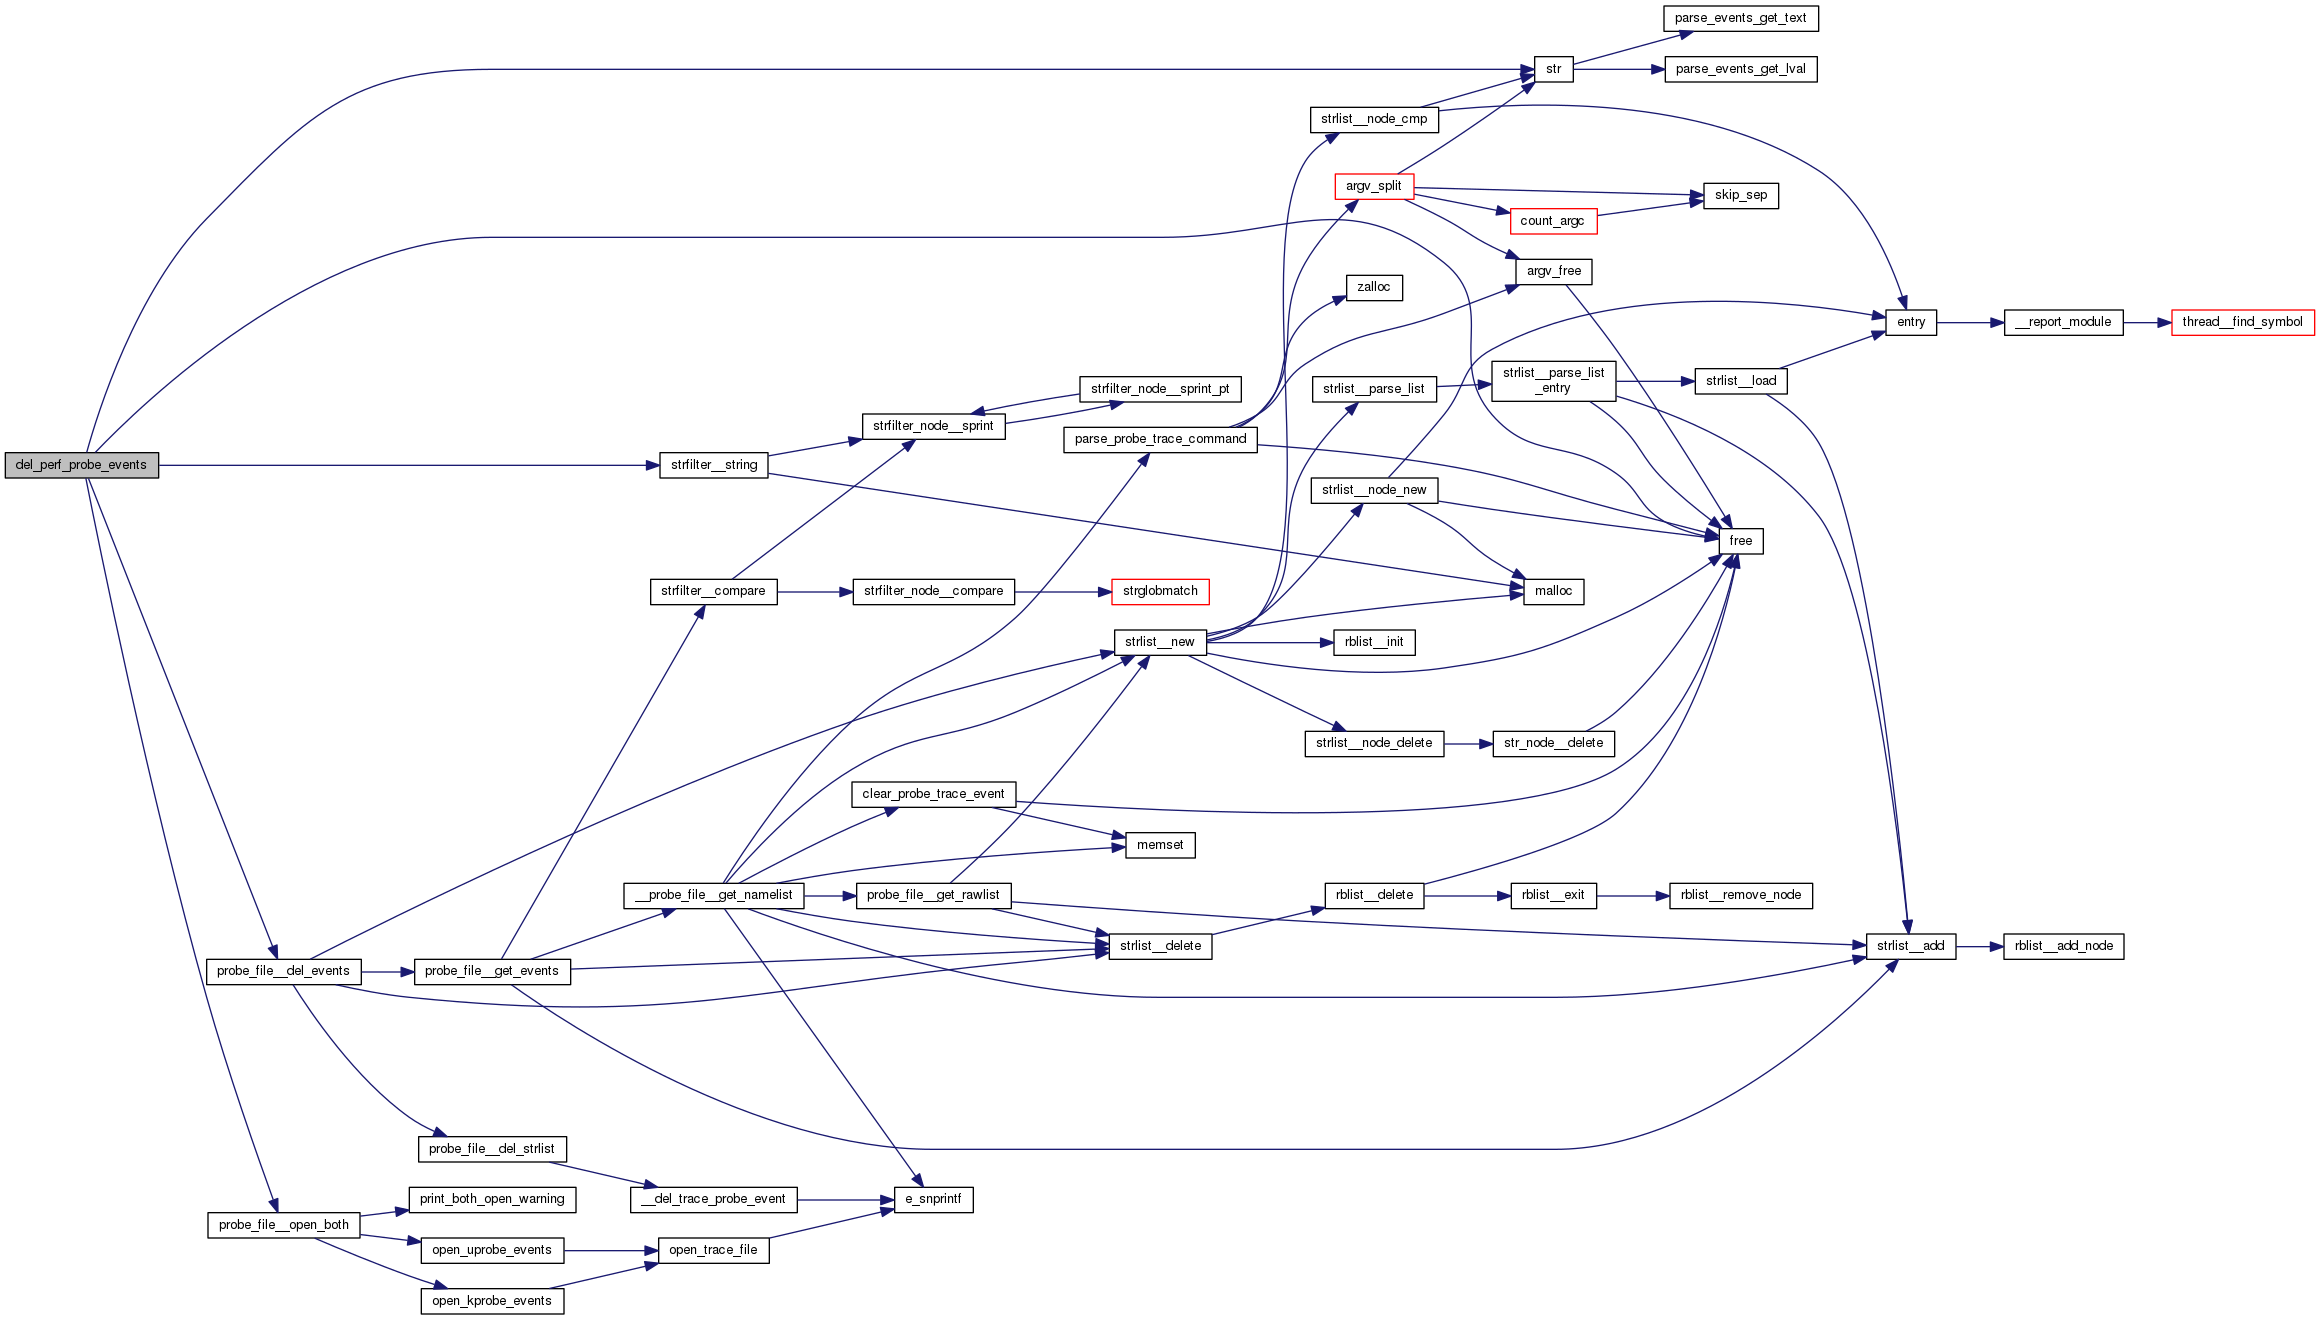
| int | del_perf_probe_events (struct strfilter *filter) |
| |
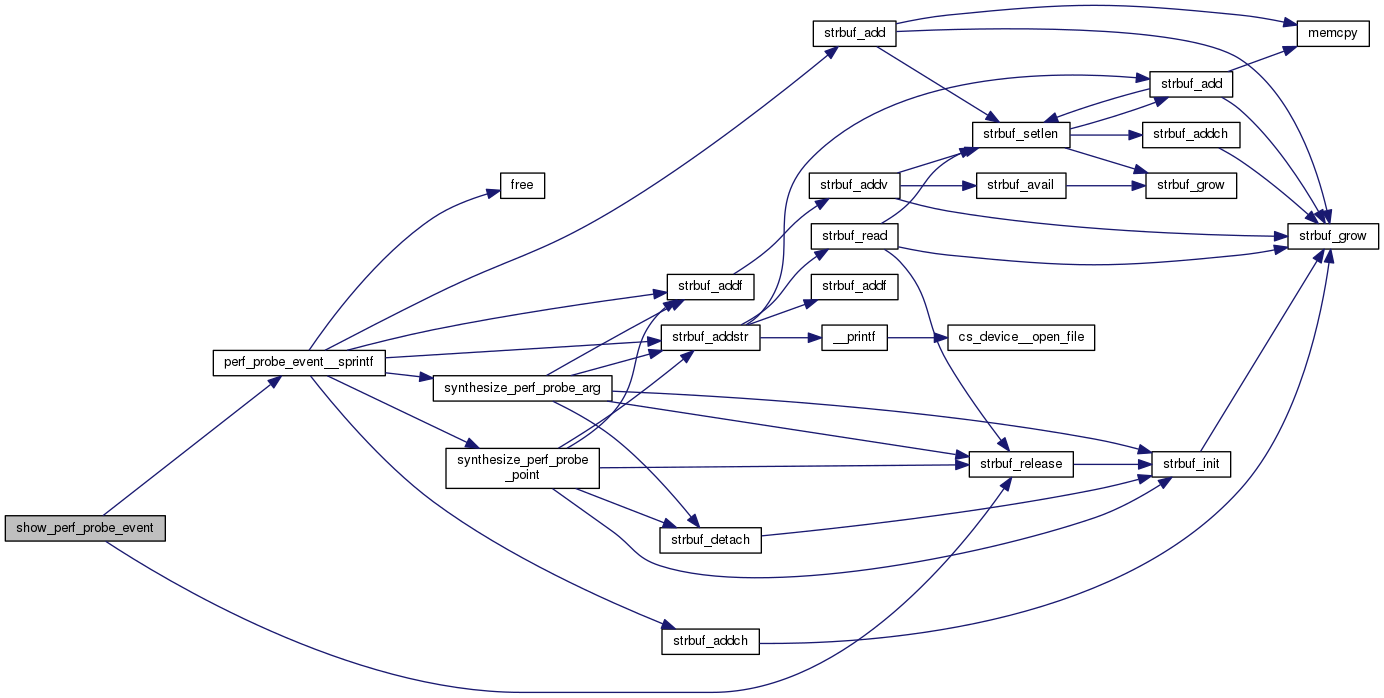
| int | show_perf_probe_event (const char *group, const char *event, struct perf_probe_event *pev, const char *module, bool use_stdout) |
| |
| int | show_perf_probe_events (struct strfilter *filter) |
| |
| int | show_line_range (struct line_range *lr, const char *module, struct nsinfo *nsi, bool user) |
| |
| int | show_available_vars (struct perf_probe_event *pevs, int npevs, struct strfilter *filter) |
| |
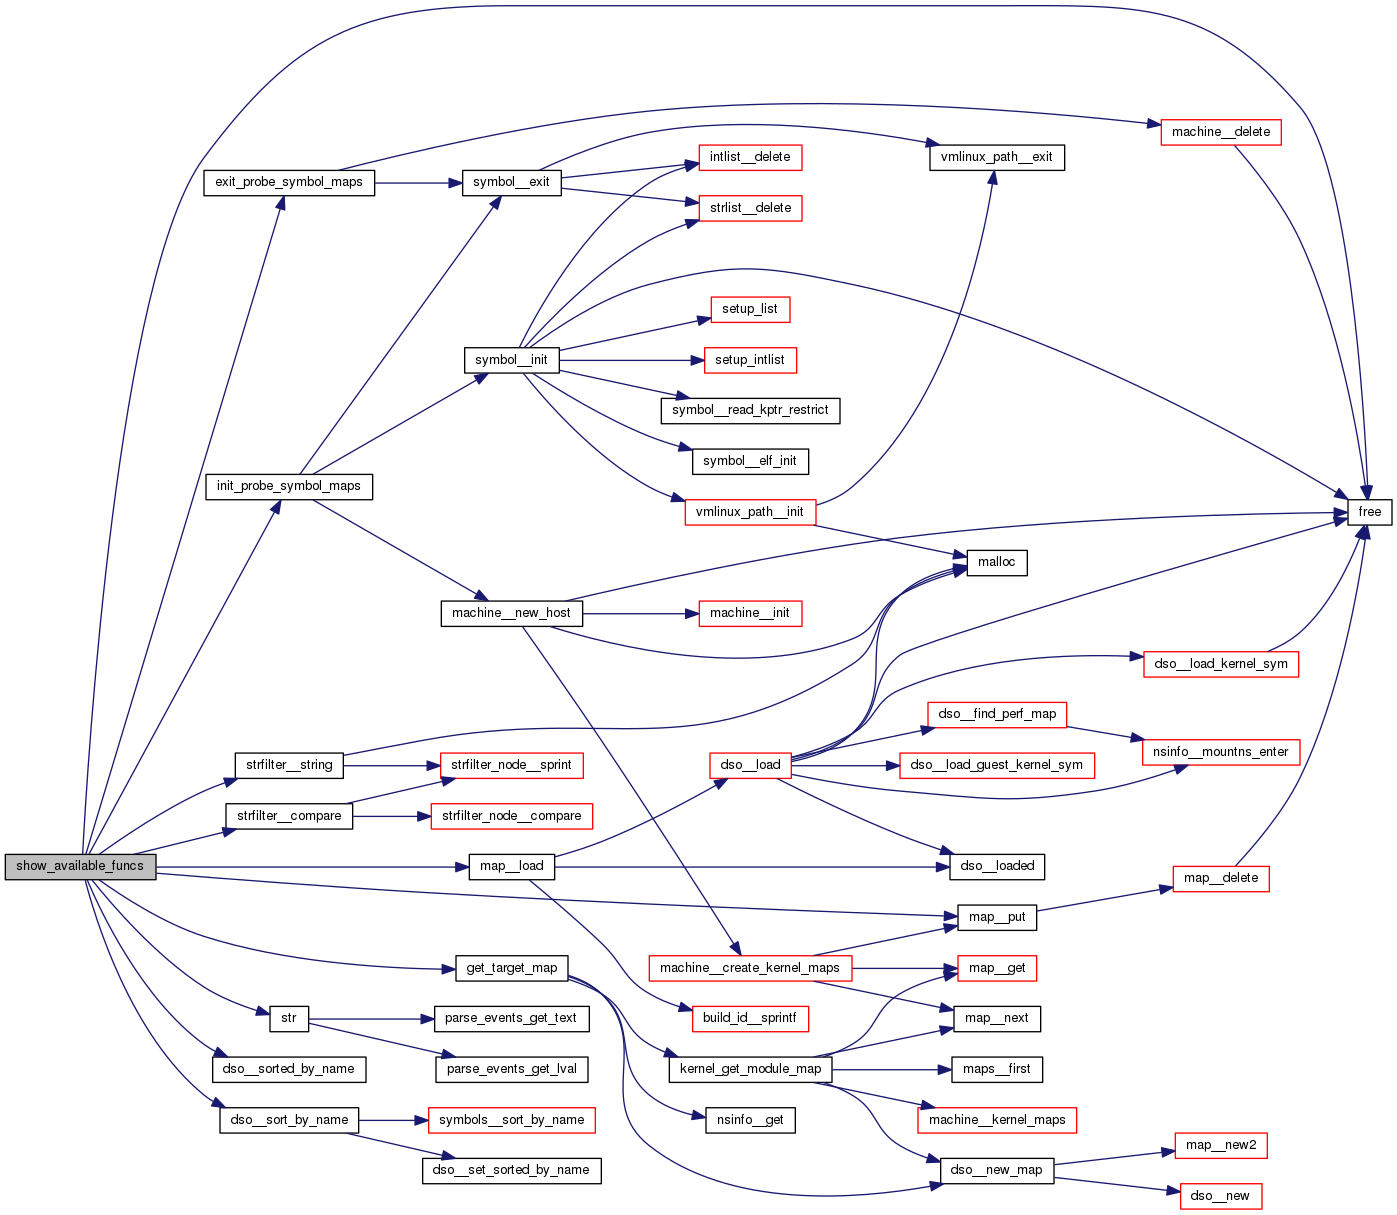
| int | show_available_funcs (const char *module, struct nsinfo *nsi, struct strfilter *filter, bool user) |
| |
| void | arch__fix_tev_from_maps (struct perf_probe_event *pev, struct probe_trace_event *tev, struct map *map, struct symbol *sym) |
| |
| int | e_snprintf (char *str, size_t size, const char *format,...) __printf(3 |
| |
| int | copy_to_probe_trace_arg (struct probe_trace_arg *tvar, struct perf_probe_arg *pvar) |
| |
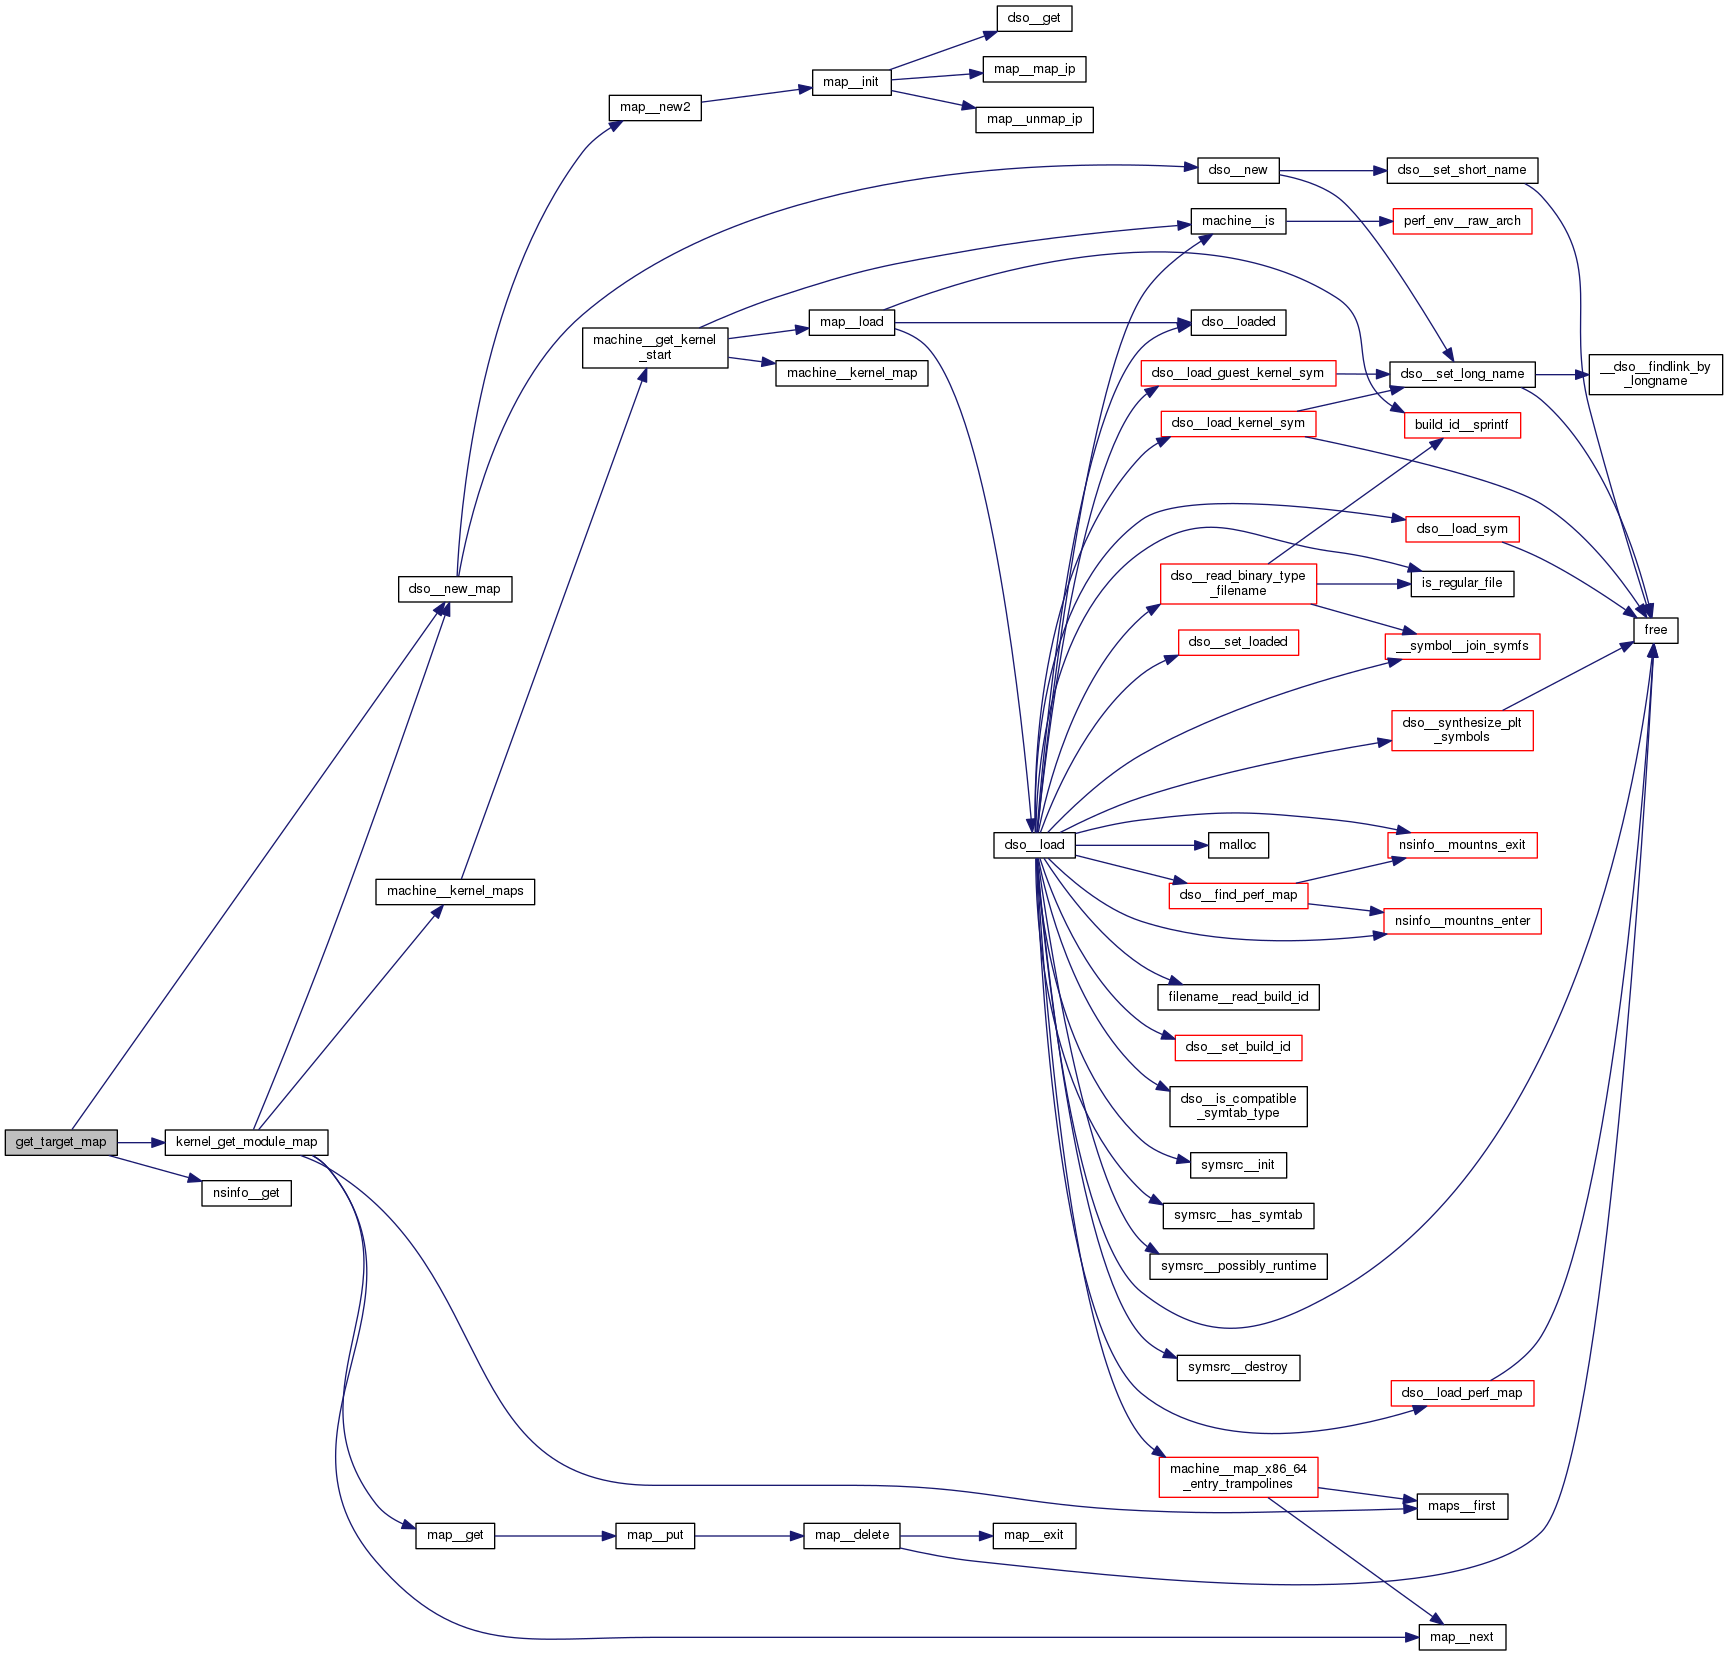
| struct map * | get_target_map (const char *target, struct nsinfo *nsi, bool user) |
| |
| void | arch__post_process_probe_trace_events (struct perf_probe_event *pev, int ntevs) |
| |