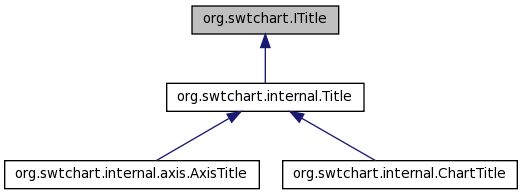
org.swtchart.ITitle Interface Reference
A title. More...
Public Member Functions | |
| void | setText (String title) |
| Sets the title text. | |
| String | getText () |
| Gets the title text. | |
| void | setFont (Font font) |
| Sets the font for title text. | |
| Font | getFont () |
| Gets the font for title text. | |
| void | setForeground (Color color) |
| Sets the foreground color of title. | |
| Color | getForeground () |
| Gets the foreground color of title. | |
| void | setStyleRanges (StyleRange[] styleRanges) |
| Sets the style ranges. | |
| StyleRange[] | getStyleRanges () |
| Gets the style ranges. | |
| void | setVisible (boolean visible) |
| Sets the visibility state of title. | |
| boolean | isVisible () |
| Gets the visibility state. | |
Detailed Description
A title.
Definition at line 16 of file ITitle.java.
Member Function Documentation
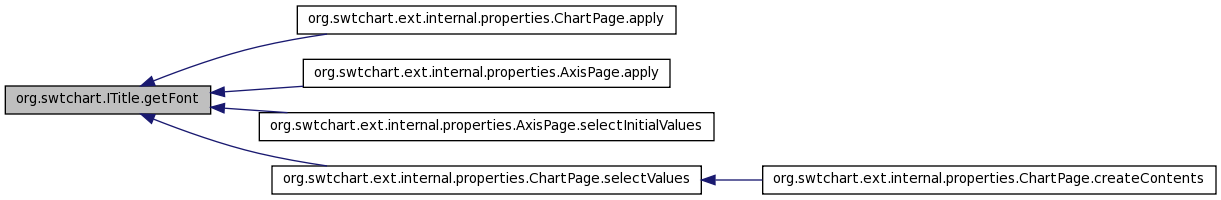
| Font org.swtchart.ITitle.getFont | ( | ) |
Gets the font for title text.
- Returns:
- the font size for title text
Implemented in org.swtchart.internal.Title.
Referenced by org.swtchart.ext.internal.properties.ChartPage.apply(), org.swtchart.ext.internal.properties.AxisPage.apply(), org.swtchart.ext.internal.properties.AxisPage.selectInitialValues(), and org.swtchart.ext.internal.properties.ChartPage.selectValues().
| Color org.swtchart.ITitle.getForeground | ( | ) |
Gets the foreground color of title.
- Returns:
- the foreground color of title
Implemented in org.swtchart.internal.Title.
Referenced by org.swtchart.ext.internal.properties.AxisPage.selectInitialValues(), and org.swtchart.ext.internal.properties.ChartPage.selectValues().

| StyleRange [] org.swtchart.ITitle.getStyleRanges | ( | ) |
| String org.swtchart.ITitle.getText | ( | ) |
Gets the title text.
- Returns:
- the title text
Implemented in org.swtchart.internal.Title.
Referenced by org.swtchart.ext.internal.properties.AxisPage.selectInitialValues(), and org.swtchart.ext.internal.properties.ChartPage.selectValues().

| boolean org.swtchart.ITitle.isVisible | ( | ) |
Gets the visibility state.
- Returns:
- true if title is visible
Implemented in org.swtchart.internal.Title.
Referenced by org.swtchart.ext.internal.properties.AxisPage.selectInitialValues(), and org.swtchart.ext.internal.properties.ChartPage.selectValues().

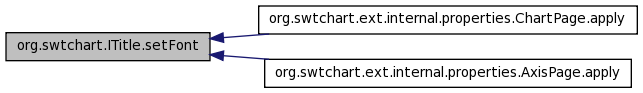
| void org.swtchart.ITitle.setFont | ( | Font | font | ) |
Sets the font for title text.
- Parameters:
-
font the font for title text
Implemented in org.swtchart.internal.Title.
Referenced by org.swtchart.ext.internal.properties.ChartPage.apply(), and org.swtchart.ext.internal.properties.AxisPage.apply().
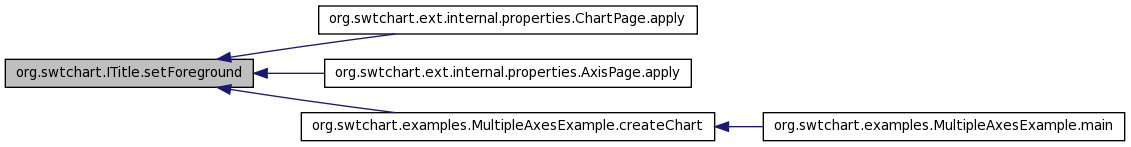
| void org.swtchart.ITitle.setForeground | ( | Color | color | ) |
Sets the foreground color of title.
- Parameters:
-
color the foreground color of title
Implemented in org.swtchart.internal.Title.
Referenced by org.swtchart.ext.internal.properties.ChartPage.apply(), org.swtchart.ext.internal.properties.AxisPage.apply(), and org.swtchart.examples.MultipleAxesExample.createChart().
| void org.swtchart.ITitle.setStyleRanges | ( | StyleRange[] | styleRanges | ) |
Sets the style ranges.
When style ranges are set, the font and background color set by setFont(Font) and setForeground(Color) makes no effect. Instead, the font and background color in style ranges are used.
- Parameters:
-
styleRanges the style ranges, or nullto clear the currently set style ranges.
Implemented in org.swtchart.internal.Title.
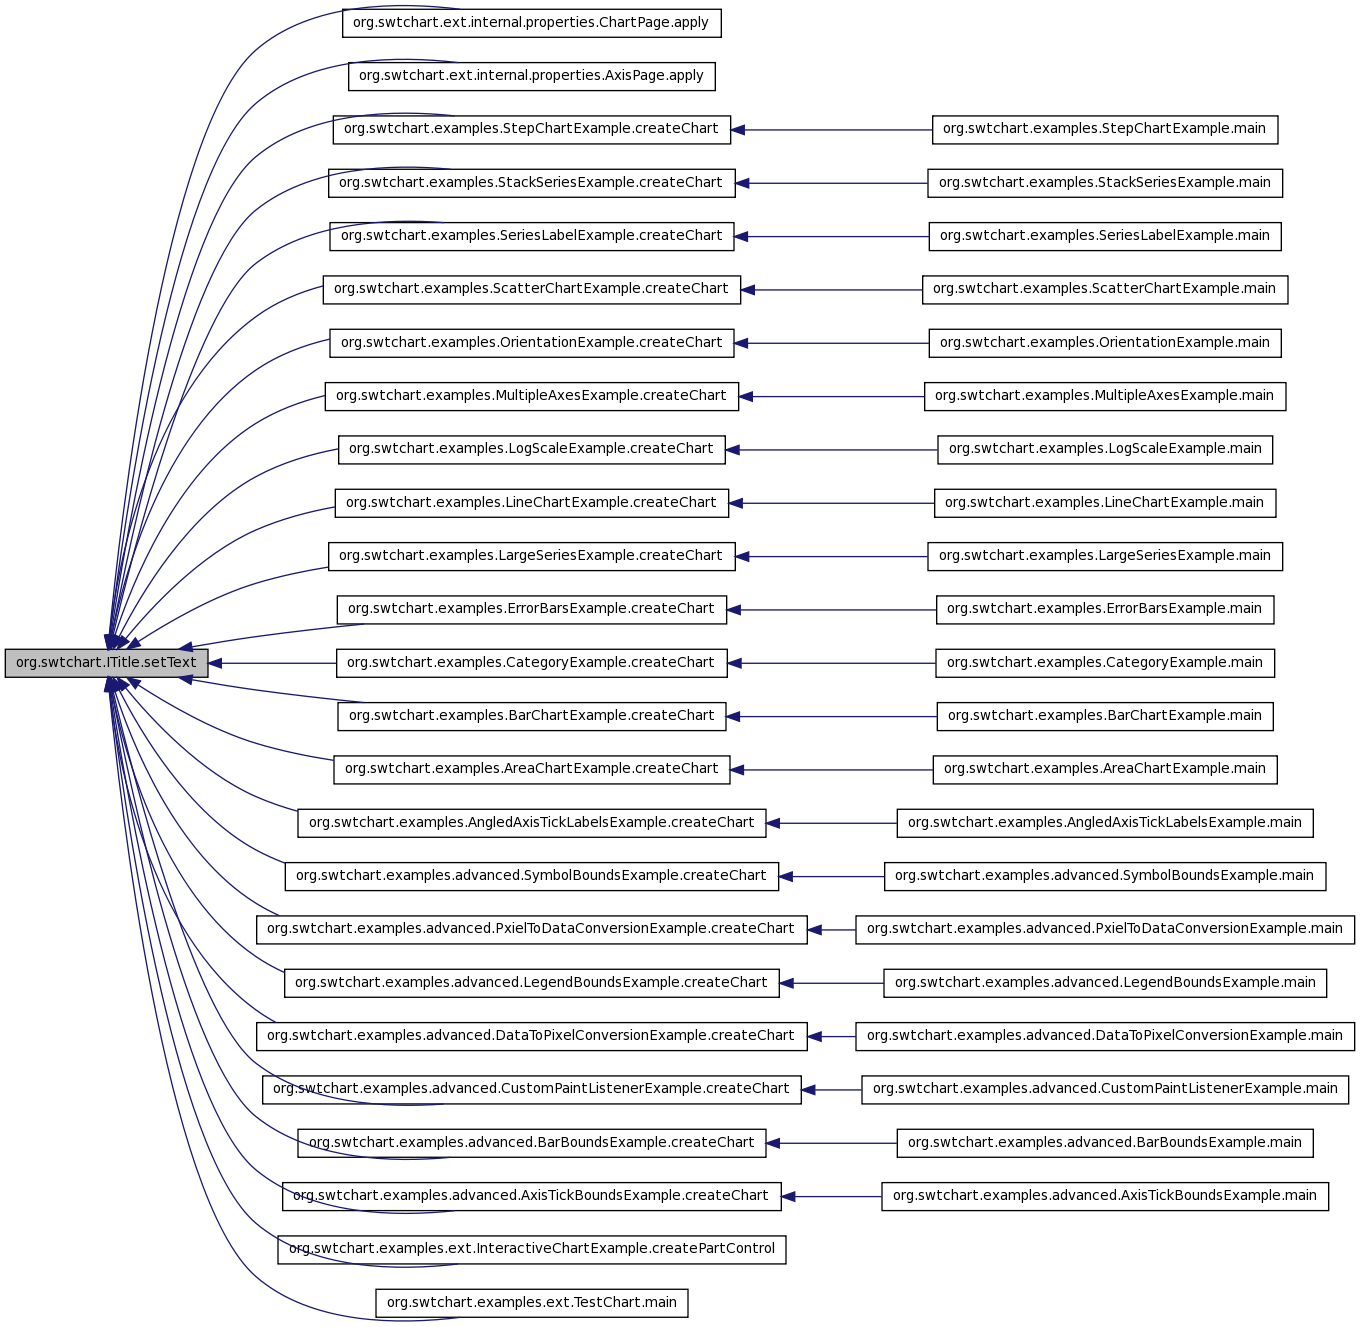
| void org.swtchart.ITitle.setText | ( | String | title | ) |
Sets the title text.
- Parameters:
-
title the title text
Implemented in org.swtchart.internal.Title.
Referenced by org.swtchart.ext.internal.properties.ChartPage.apply(), org.swtchart.ext.internal.properties.AxisPage.apply(), org.swtchart.examples.StepChartExample.createChart(), org.swtchart.examples.StackSeriesExample.createChart(), org.swtchart.examples.SeriesLabelExample.createChart(), org.swtchart.examples.ScatterChartExample.createChart(), org.swtchart.examples.OrientationExample.createChart(), org.swtchart.examples.MultipleAxesExample.createChart(), org.swtchart.examples.LogScaleExample.createChart(), org.swtchart.examples.LineChartExample.createChart(), org.swtchart.examples.LargeSeriesExample.createChart(), org.swtchart.examples.ErrorBarsExample.createChart(), org.swtchart.examples.CategoryExample.createChart(), org.swtchart.examples.BarChartExample.createChart(), org.swtchart.examples.AreaChartExample.createChart(), org.swtchart.examples.AngledAxisTickLabelsExample.createChart(), org.swtchart.examples.advanced.SymbolBoundsExample.createChart(), org.swtchart.examples.advanced.PxielToDataConversionExample.createChart(), org.swtchart.examples.advanced.LegendBoundsExample.createChart(), org.swtchart.examples.advanced.DataToPixelConversionExample.createChart(), org.swtchart.examples.advanced.CustomPaintListenerExample.createChart(), org.swtchart.examples.advanced.BarBoundsExample.createChart(), org.swtchart.examples.advanced.AxisTickBoundsExample.createChart(), org.swtchart.examples.ext.InteractiveChartExample.createPartControl(), and org.swtchart.examples.ext.TestChart.main().
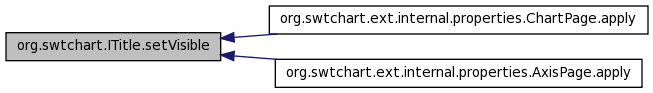
| void org.swtchart.ITitle.setVisible | ( | boolean | visible | ) |
Sets the visibility state of title.
- Parameters:
-
visible the visibility state
Implemented in org.swtchart.internal.Title.
Referenced by org.swtchart.ext.internal.properties.ChartPage.apply(), and org.swtchart.ext.internal.properties.AxisPage.apply().
The documentation for this interface was generated from the following file:
- org.swtchart/src/org/swtchart/ITitle.java