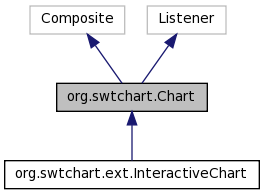
org.swtchart.Chart Class Reference
A chart which are composed of title, legend, axes and plot area. More...
Public Member Functions | |
| Chart (Composite parent, int style) | |
| Constructor. | |
| ITitle | getTitle () |
| Gets the chart title. | |
| ILegend | getLegend () |
| Gets the legend. | |
| IAxisSet | getAxisSet () |
| Gets the set of axes. | |
| Composite | getPlotArea () |
| Gets the plot area. | |
| ISeriesSet | getSeriesSet () |
| Gets the set of series. | |
| void | setBackground (Color color) |
| Color | getBackgroundInPlotArea () |
| Gets the background color in plot area. | |
| void | setBackgroundInPlotArea (Color color) |
| Sets the background color in plot area. | |
| void | setOrientation (int orientation) |
| Sets the state of chart orientation. | |
| int | getOrientation () |
| Gets the state of chart orientation. | |
| void | enableCompress (boolean enabled) |
| Enables compressing series. | |
| boolean | isCompressEnabled () |
| Gets the state indicating if compressing series is enabled. | |
| void | suspendUpdate (boolean suspend) |
| Suspends the update of chart appearance. | |
| boolean | isUpdateSuspended () |
| Gets the state indicating if the update of chart appearance is suspended. | |
| void | handleEvent (Event event) |
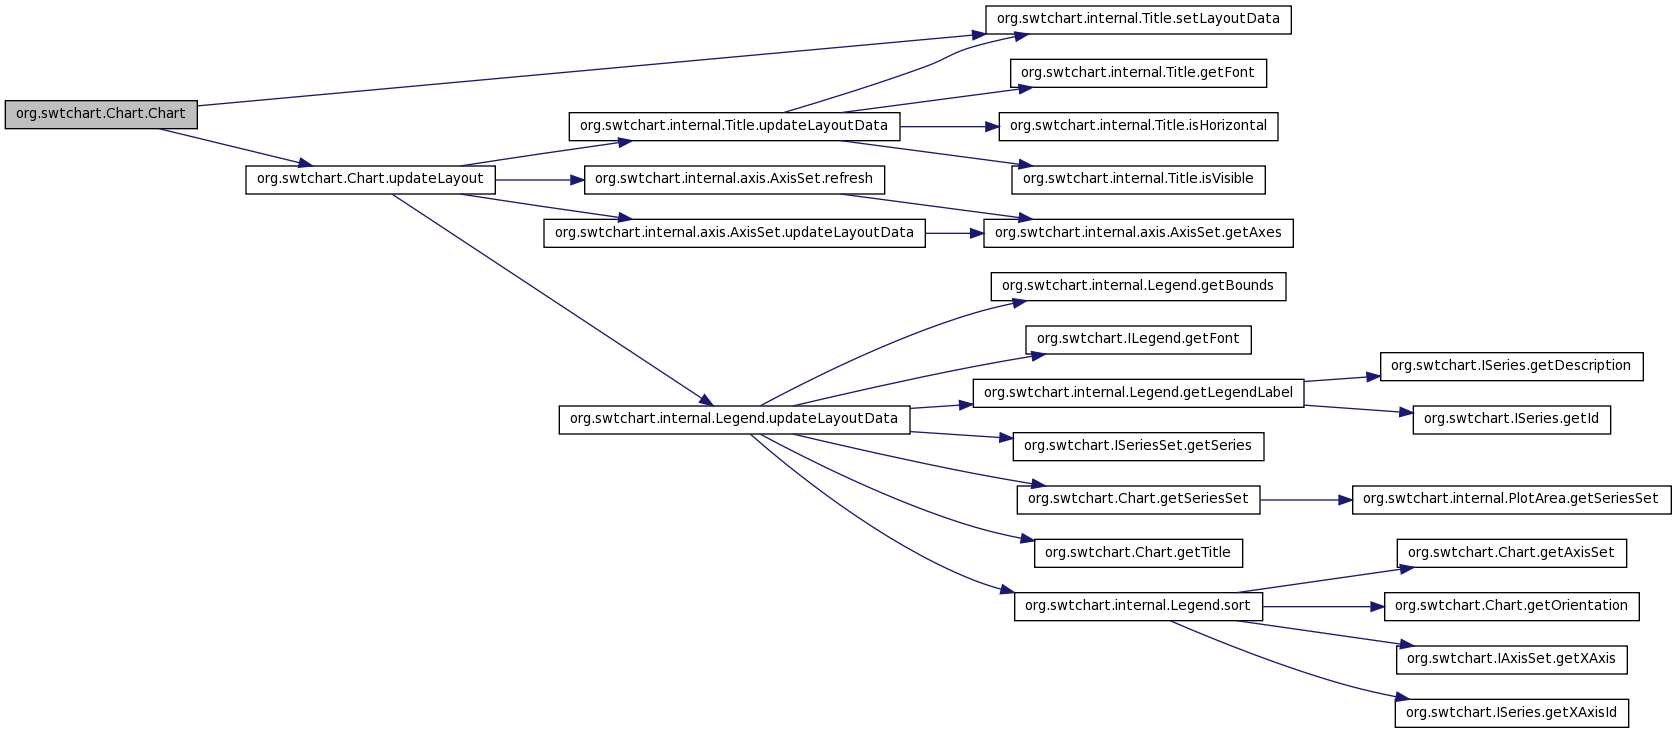
| void | updateLayout () |
| Updates the layout of chart elements. | |
| void | update () |
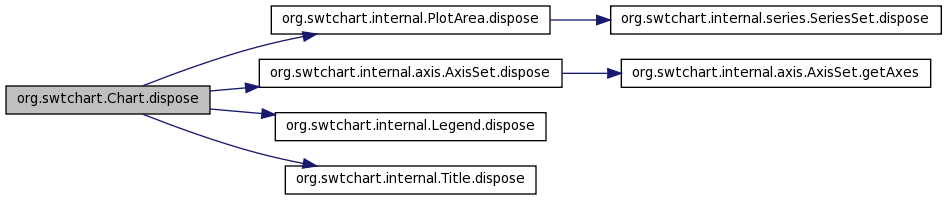
| void | dispose () |
| void | redraw () |
| void | save (String filename, int format) |
| Saves to file with given format. | |
| void | renderOffscreenImage (Image image) |
| Renders off-screen image. | |
Private Attributes | |
| Title | title |
| the title | |
| Legend | legend |
| the legend | |
| AxisSet | axisSet |
| the set of axes | |
| PlotArea | plotArea |
| the plot area | |
| int | orientation |
| the orientation of chart which can be horizontal or vertical | |
| boolean | compressEnabled |
| the state indicating if compressing series is enabled | |
| boolean | updateSuspended |
| the state indicating if the update of chart appearance is suspended | |
Detailed Description
A chart which are composed of title, legend, axes and plot area.
Definition at line 32 of file Chart.java.
Constructor & Destructor Documentation
| org.swtchart.Chart.Chart | ( | Composite | parent, | |
| int | style | |||
| ) |
Constructor.
- Parameters:
-
parent the parent composite on which chart is placed style the style of widget to construct
Definition at line 63 of file Chart.java.
References org.swtchart.Chart.axisSet, org.swtchart.Chart.compressEnabled, org.swtchart.Chart.legend, org.swtchart.Chart.orientation, org.swtchart.Chart.plotArea, org.swtchart.internal.Title.setLayoutData(), org.swtchart.Chart.title, org.swtchart.Chart.updateLayout(), and org.swtchart.Chart.updateSuspended.
Member Function Documentation
| void org.swtchart.Chart.dispose | ( | ) |
Reimplemented in org.swtchart.ext.InteractiveChart.
Definition at line 335 of file Chart.java.
References org.swtchart.Chart.axisSet, org.swtchart.internal.PlotArea.dispose(), org.swtchart.internal.axis.AxisSet.dispose(), org.swtchart.internal.Legend.dispose(), org.swtchart.internal.Title.dispose(), org.swtchart.Chart.legend, org.swtchart.Chart.plotArea, and org.swtchart.Chart.title.
Referenced by org.swtchart.examples.ext.InteractiveChartExample.dispose().

| void org.swtchart.Chart.enableCompress | ( | boolean | enabled | ) |
Enables compressing series.
By default, compressing series is enabled, and normally there should be no usecase to disable it. However, if you suspect that something is wrong in compressing series, you can disable it to isolate the issue.
- Parameters:
-
enabled true if enabling compressing series
Definition at line 208 of file Chart.java.
References org.swtchart.Chart.compressEnabled.
| IAxisSet org.swtchart.Chart.getAxisSet | ( | ) |
Gets the set of axes.
- Returns:
- the set of axes
Definition at line 109 of file Chart.java.
References org.swtchart.Chart.axisSet.
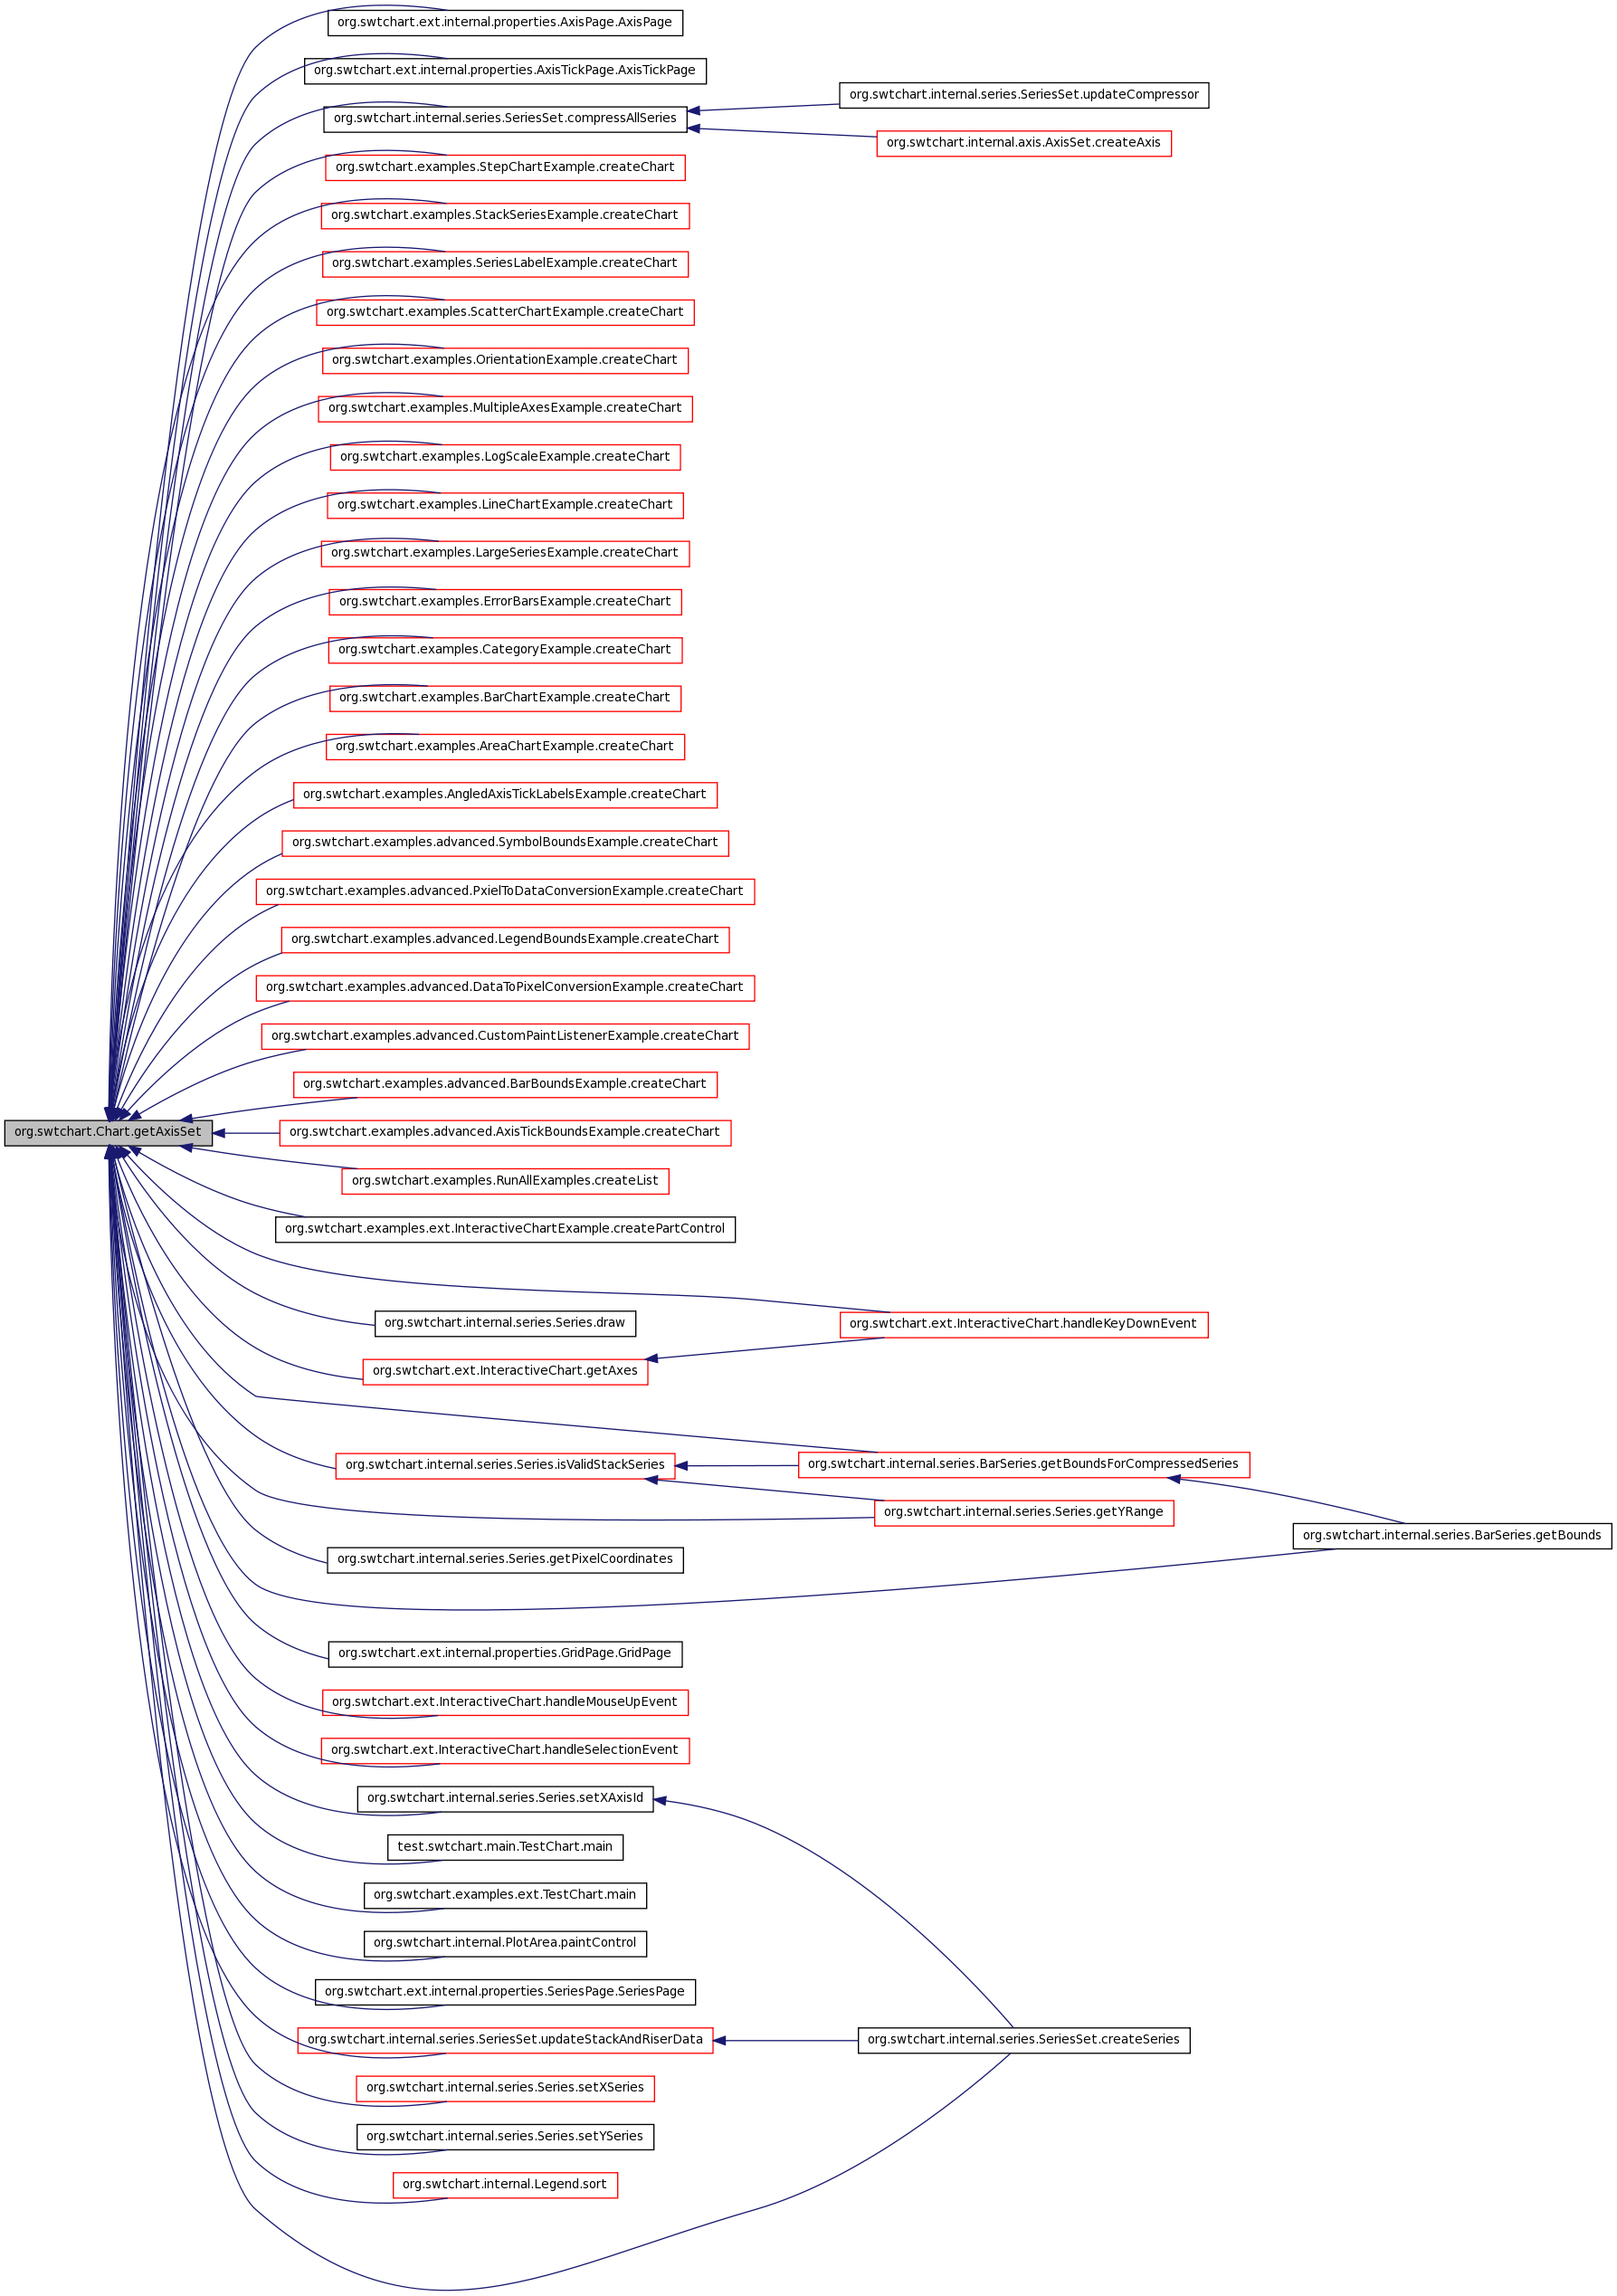
Referenced by org.swtchart.ext.internal.properties.AxisPage.AxisPage(), org.swtchart.ext.internal.properties.AxisTickPage.AxisTickPage(), org.swtchart.internal.series.SeriesSet.compressAllSeries(), org.swtchart.examples.StepChartExample.createChart(), org.swtchart.examples.StackSeriesExample.createChart(), org.swtchart.examples.SeriesLabelExample.createChart(), org.swtchart.examples.ScatterChartExample.createChart(), org.swtchart.examples.OrientationExample.createChart(), org.swtchart.examples.MultipleAxesExample.createChart(), org.swtchart.examples.LogScaleExample.createChart(), org.swtchart.examples.LineChartExample.createChart(), org.swtchart.examples.LargeSeriesExample.createChart(), org.swtchart.examples.ErrorBarsExample.createChart(), org.swtchart.examples.CategoryExample.createChart(), org.swtchart.examples.BarChartExample.createChart(), org.swtchart.examples.AreaChartExample.createChart(), org.swtchart.examples.AngledAxisTickLabelsExample.createChart(), org.swtchart.examples.advanced.SymbolBoundsExample.createChart(), org.swtchart.examples.advanced.PxielToDataConversionExample.createChart(), org.swtchart.examples.advanced.LegendBoundsExample.createChart(), org.swtchart.examples.advanced.DataToPixelConversionExample.createChart(), org.swtchart.examples.advanced.CustomPaintListenerExample.createChart(), org.swtchart.examples.advanced.BarBoundsExample.createChart(), org.swtchart.examples.advanced.AxisTickBoundsExample.createChart(), org.swtchart.examples.RunAllExamples.createList(), org.swtchart.examples.ext.InteractiveChartExample.createPartControl(), org.swtchart.internal.series.SeriesSet.createSeries(), org.swtchart.internal.series.Series.draw(), org.swtchart.ext.InteractiveChart.getAxes(), org.swtchart.internal.series.BarSeries.getBounds(), org.swtchart.internal.series.BarSeries.getBoundsForCompressedSeries(), org.swtchart.internal.series.Series.getPixelCoordinates(), org.swtchart.internal.series.Series.getYRange(), org.swtchart.ext.internal.properties.GridPage.GridPage(), org.swtchart.ext.InteractiveChart.handleKeyDownEvent(), org.swtchart.ext.InteractiveChart.handleMouseUpEvent(), org.swtchart.ext.InteractiveChart.handleSelectionEvent(), org.swtchart.internal.series.Series.isValidStackSeries(), test.swtchart.main.TestChart.main(), org.swtchart.examples.ext.TestChart.main(), org.swtchart.internal.PlotArea.paintControl(), org.swtchart.ext.internal.properties.SeriesPage.SeriesPage(), org.swtchart.internal.series.Series.setXAxisId(), org.swtchart.internal.series.Series.setXSeries(), org.swtchart.internal.series.Series.setYSeries(), org.swtchart.internal.Legend.sort(), and org.swtchart.internal.series.SeriesSet.updateStackAndRiserData().
| Color org.swtchart.Chart.getBackgroundInPlotArea | ( | ) |
Gets the background color in plot area.
This method is identical with getPlotArea().getBackground().
- Returns:
- the background color in plot area
Definition at line 151 of file Chart.java.
References org.swtchart.Chart.plotArea.
| ILegend org.swtchart.Chart.getLegend | ( | ) |
Gets the legend.
- Returns:
- the legend
Definition at line 100 of file Chart.java.
References org.swtchart.Chart.legend.
Referenced by org.swtchart.examples.advanced.LegendBoundsExample.createChart(), and org.swtchart.ext.internal.properties.LegendPage.LegendPage().

| int org.swtchart.Chart.getOrientation | ( | ) |
Gets the state of chart orientation.
The horizontal orientation means that X axis is horizontal as usual, while the vertical orientation means that Y axis is horizontal.
- Returns:
- the orientation which can be SWT.HORIZONTAL or SWT.VERTICAL
Definition at line 195 of file Chart.java.
References org.swtchart.Chart.orientation.
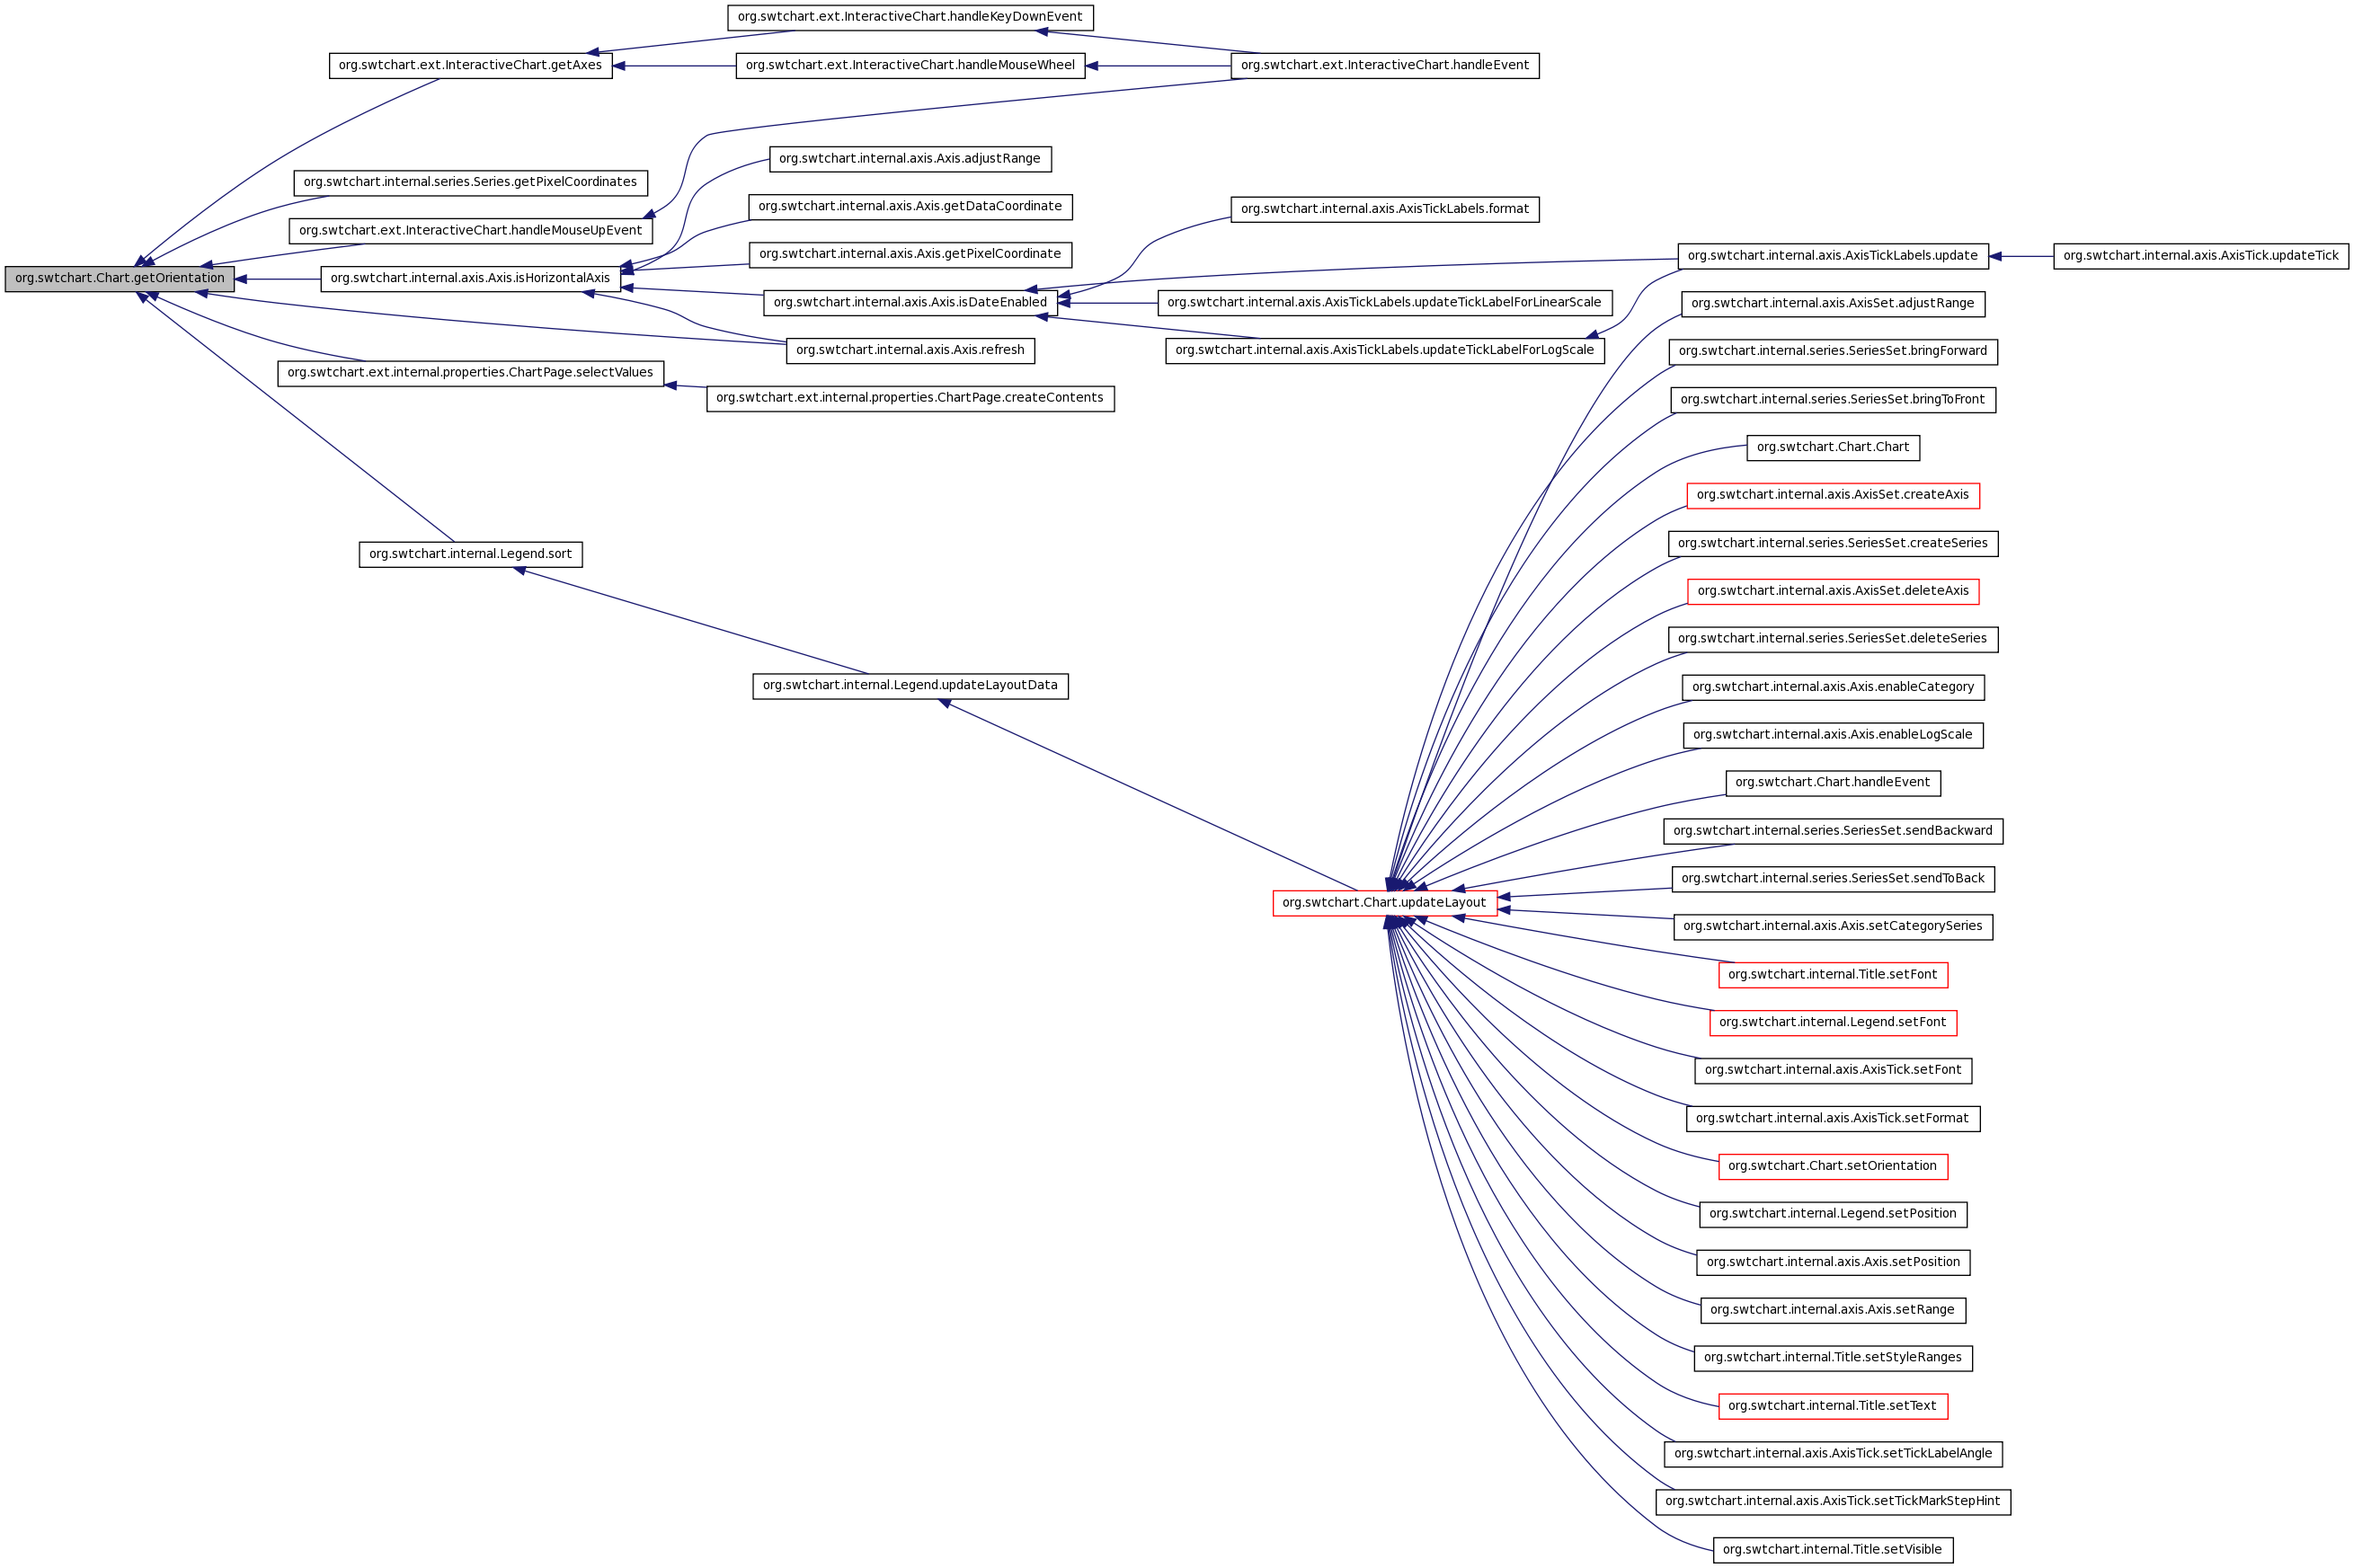
Referenced by org.swtchart.ext.InteractiveChart.getAxes(), org.swtchart.internal.series.Series.getPixelCoordinates(), org.swtchart.ext.InteractiveChart.handleMouseUpEvent(), org.swtchart.internal.axis.Axis.isHorizontalAxis(), org.swtchart.internal.axis.Axis.refresh(), org.swtchart.ext.internal.properties.ChartPage.selectValues(), and org.swtchart.internal.Legend.sort().
| Composite org.swtchart.Chart.getPlotArea | ( | ) |
Gets the plot area.
- Returns:
- the plot area
Definition at line 118 of file Chart.java.
References org.swtchart.Chart.plotArea.
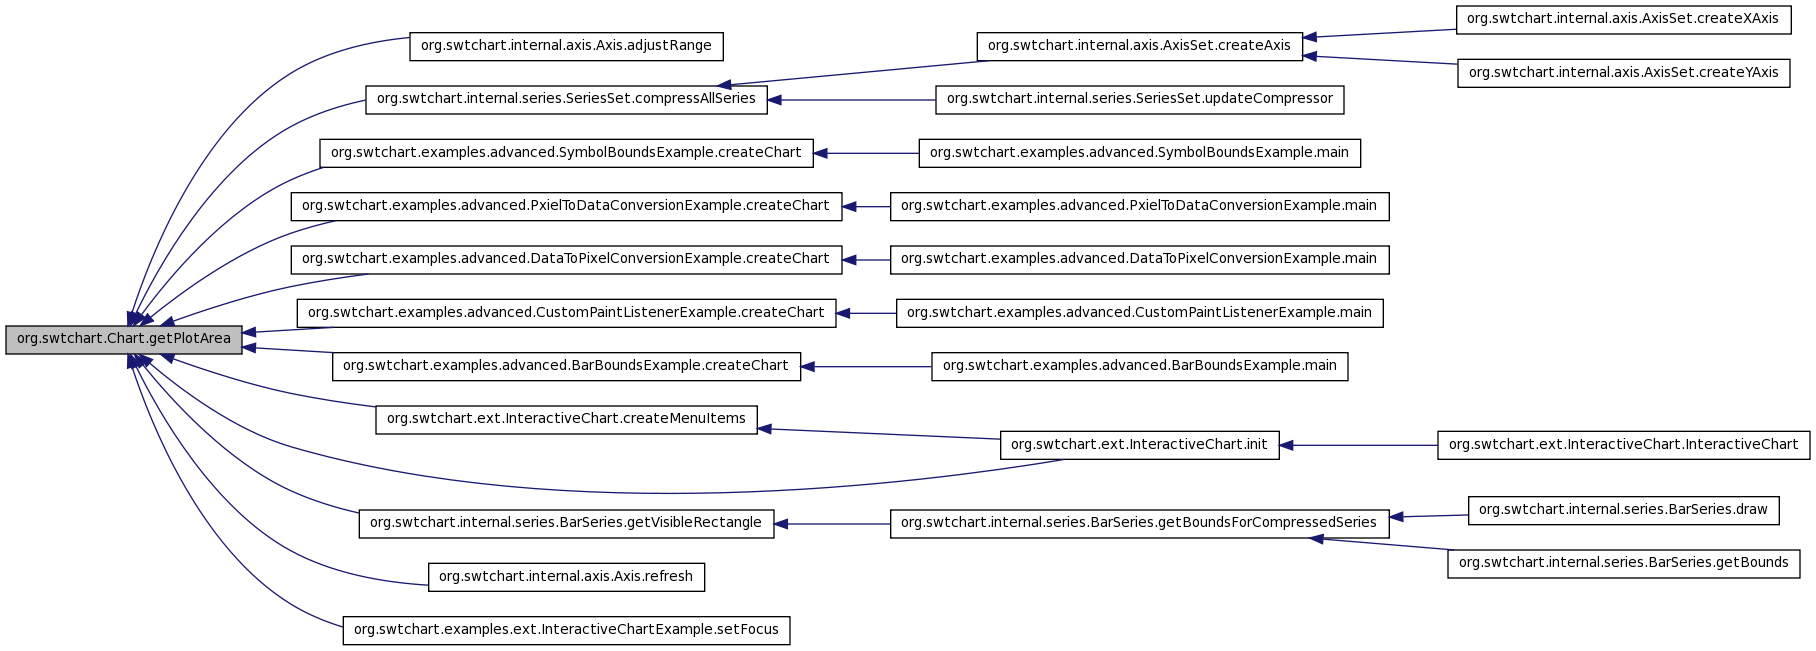
Referenced by org.swtchart.internal.axis.Axis.adjustRange(), org.swtchart.internal.series.SeriesSet.compressAllSeries(), org.swtchart.examples.advanced.SymbolBoundsExample.createChart(), org.swtchart.examples.advanced.PxielToDataConversionExample.createChart(), org.swtchart.examples.advanced.DataToPixelConversionExample.createChart(), org.swtchart.examples.advanced.CustomPaintListenerExample.createChart(), org.swtchart.examples.advanced.BarBoundsExample.createChart(), org.swtchart.ext.InteractiveChart.createMenuItems(), org.swtchart.internal.series.BarSeries.getVisibleRectangle(), org.swtchart.ext.InteractiveChart.init(), org.swtchart.internal.axis.Axis.refresh(), and org.swtchart.examples.ext.InteractiveChartExample.setFocus().
| ISeriesSet org.swtchart.Chart.getSeriesSet | ( | ) |
Gets the set of series.
- Returns:
- the set of series
Definition at line 127 of file Chart.java.
References org.swtchart.internal.PlotArea.getSeriesSet(), and org.swtchart.Chart.plotArea.
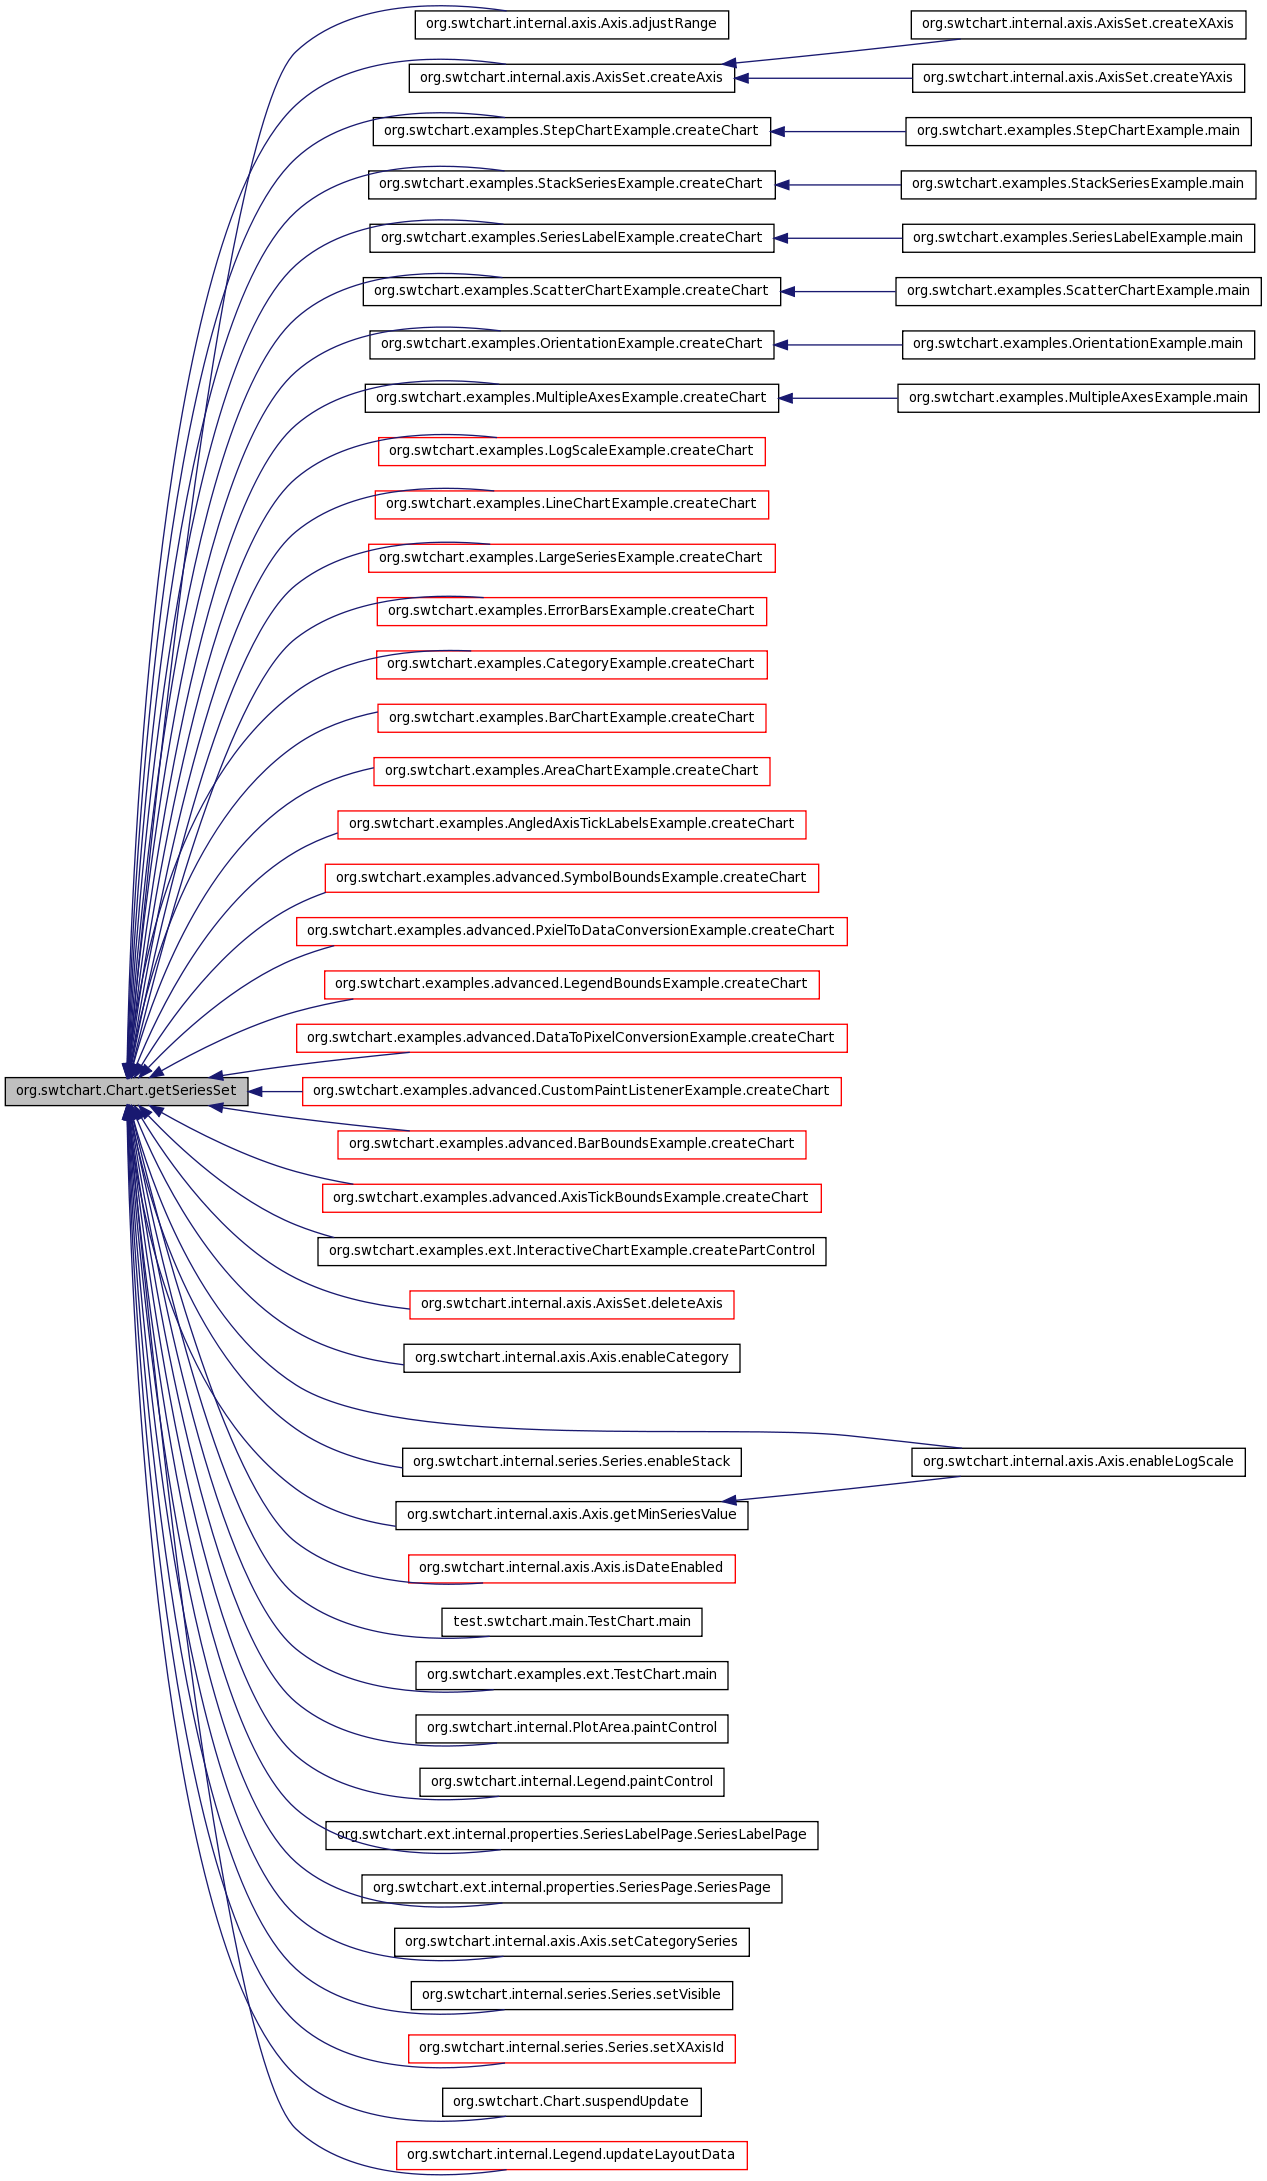
Referenced by org.swtchart.internal.axis.Axis.adjustRange(), org.swtchart.internal.axis.AxisSet.createAxis(), org.swtchart.examples.StepChartExample.createChart(), org.swtchart.examples.StackSeriesExample.createChart(), org.swtchart.examples.SeriesLabelExample.createChart(), org.swtchart.examples.ScatterChartExample.createChart(), org.swtchart.examples.OrientationExample.createChart(), org.swtchart.examples.MultipleAxesExample.createChart(), org.swtchart.examples.LogScaleExample.createChart(), org.swtchart.examples.LineChartExample.createChart(), org.swtchart.examples.LargeSeriesExample.createChart(), org.swtchart.examples.ErrorBarsExample.createChart(), org.swtchart.examples.CategoryExample.createChart(), org.swtchart.examples.BarChartExample.createChart(), org.swtchart.examples.AreaChartExample.createChart(), org.swtchart.examples.AngledAxisTickLabelsExample.createChart(), org.swtchart.examples.advanced.SymbolBoundsExample.createChart(), org.swtchart.examples.advanced.PxielToDataConversionExample.createChart(), org.swtchart.examples.advanced.LegendBoundsExample.createChart(), org.swtchart.examples.advanced.DataToPixelConversionExample.createChart(), org.swtchart.examples.advanced.CustomPaintListenerExample.createChart(), org.swtchart.examples.advanced.BarBoundsExample.createChart(), org.swtchart.examples.advanced.AxisTickBoundsExample.createChart(), org.swtchart.examples.ext.InteractiveChartExample.createPartControl(), org.swtchart.internal.axis.AxisSet.deleteAxis(), org.swtchart.internal.axis.Axis.enableCategory(), org.swtchart.internal.axis.Axis.enableLogScale(), org.swtchart.internal.series.Series.enableStack(), org.swtchart.internal.axis.Axis.getMinSeriesValue(), org.swtchart.internal.axis.Axis.isDateEnabled(), test.swtchart.main.TestChart.main(), org.swtchart.examples.ext.TestChart.main(), org.swtchart.internal.PlotArea.paintControl(), org.swtchart.internal.Legend.paintControl(), org.swtchart.ext.internal.properties.SeriesLabelPage.SeriesLabelPage(), org.swtchart.ext.internal.properties.SeriesPage.SeriesPage(), org.swtchart.internal.axis.Axis.setCategorySeries(), org.swtchart.internal.series.Series.setVisible(), org.swtchart.internal.series.Series.setXAxisId(), org.swtchart.Chart.suspendUpdate(), and org.swtchart.internal.Legend.updateLayoutData().

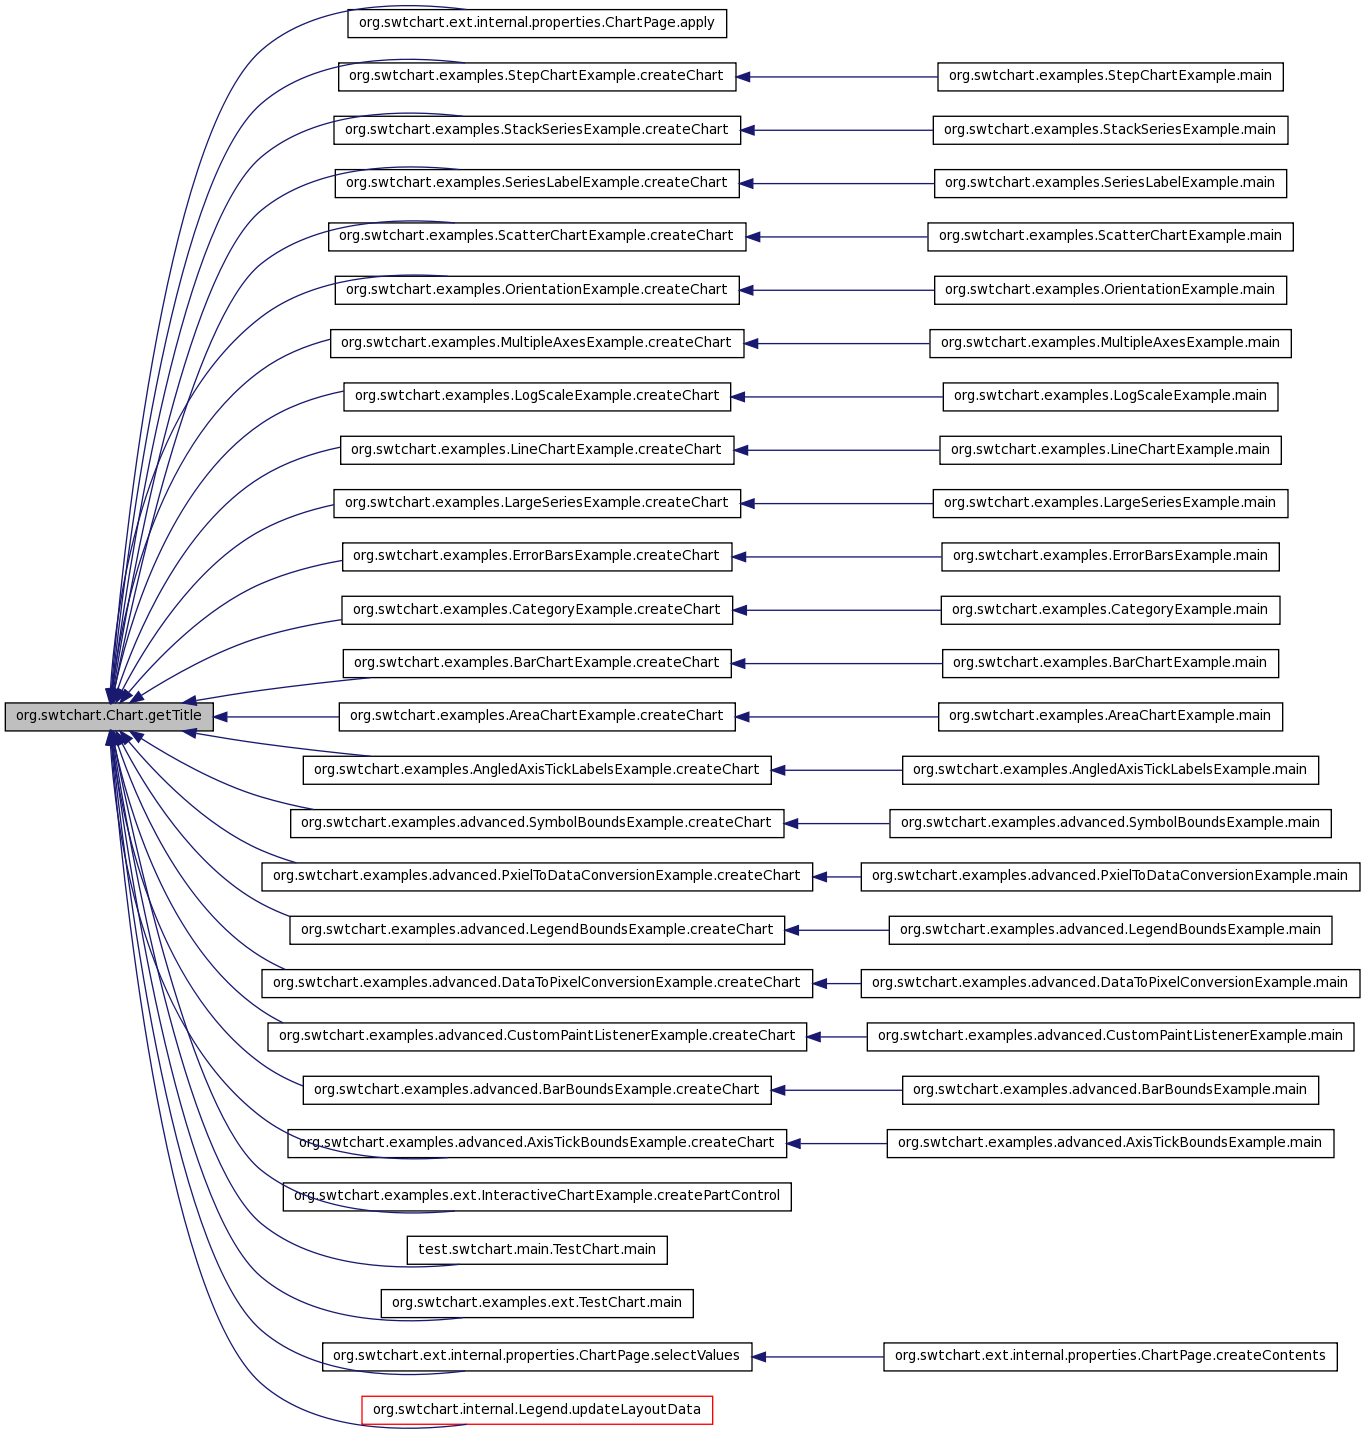
| ITitle org.swtchart.Chart.getTitle | ( | ) |
Gets the chart title.
- Returns:
- the chart title
Definition at line 91 of file Chart.java.
References org.swtchart.Chart.title.
Referenced by org.swtchart.ext.internal.properties.ChartPage.apply(), org.swtchart.examples.StepChartExample.createChart(), org.swtchart.examples.StackSeriesExample.createChart(), org.swtchart.examples.SeriesLabelExample.createChart(), org.swtchart.examples.ScatterChartExample.createChart(), org.swtchart.examples.OrientationExample.createChart(), org.swtchart.examples.MultipleAxesExample.createChart(), org.swtchart.examples.LogScaleExample.createChart(), org.swtchart.examples.LineChartExample.createChart(), org.swtchart.examples.LargeSeriesExample.createChart(), org.swtchart.examples.ErrorBarsExample.createChart(), org.swtchart.examples.CategoryExample.createChart(), org.swtchart.examples.BarChartExample.createChart(), org.swtchart.examples.AreaChartExample.createChart(), org.swtchart.examples.AngledAxisTickLabelsExample.createChart(), org.swtchart.examples.advanced.SymbolBoundsExample.createChart(), org.swtchart.examples.advanced.PxielToDataConversionExample.createChart(), org.swtchart.examples.advanced.LegendBoundsExample.createChart(), org.swtchart.examples.advanced.DataToPixelConversionExample.createChart(), org.swtchart.examples.advanced.CustomPaintListenerExample.createChart(), org.swtchart.examples.advanced.BarBoundsExample.createChart(), org.swtchart.examples.advanced.AxisTickBoundsExample.createChart(), org.swtchart.examples.ext.InteractiveChartExample.createPartControl(), test.swtchart.main.TestChart.main(), org.swtchart.examples.ext.TestChart.main(), org.swtchart.ext.internal.properties.ChartPage.selectValues(), and org.swtchart.internal.Legend.updateLayoutData().
| void org.swtchart.Chart.handleEvent | ( | Event | event | ) |
Reimplemented in org.swtchart.ext.InteractiveChart.
Definition at line 282 of file Chart.java.
References org.swtchart.Chart.redraw(), and org.swtchart.Chart.updateLayout().
| boolean org.swtchart.Chart.isCompressEnabled | ( | ) |
Gets the state indicating if compressing series is enabled.
- Returns:
- true if compressing series is enabled
Definition at line 217 of file Chart.java.
References org.swtchart.Chart.compressEnabled.
Referenced by org.swtchart.internal.series.SeriesSet.compressAllSeries().

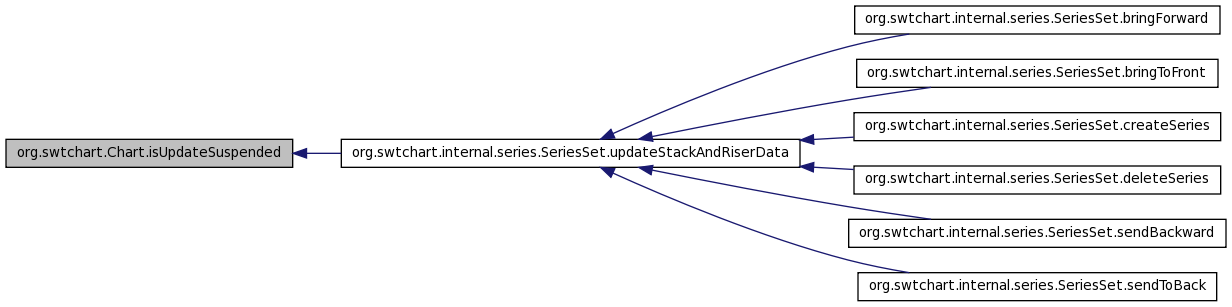
| boolean org.swtchart.Chart.isUpdateSuspended | ( | ) |
Gets the state indicating if the update of chart appearance is suspended.
- Returns:
- true if the update of chart appearance is suspended
Definition at line 275 of file Chart.java.
References org.swtchart.Chart.updateSuspended.
Referenced by org.swtchart.internal.series.SeriesSet.updateStackAndRiserData().
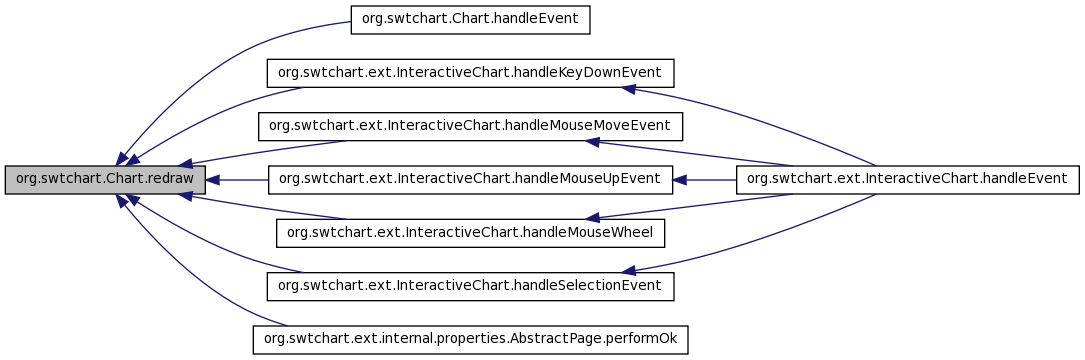
| void org.swtchart.Chart.redraw | ( | ) |
Definition at line 347 of file Chart.java.
Referenced by org.swtchart.Chart.handleEvent(), org.swtchart.ext.InteractiveChart.handleKeyDownEvent(), org.swtchart.ext.InteractiveChart.handleMouseMoveEvent(), org.swtchart.ext.InteractiveChart.handleMouseUpEvent(), org.swtchart.ext.InteractiveChart.handleMouseWheel(), org.swtchart.ext.InteractiveChart.handleSelectionEvent(), and org.swtchart.ext.internal.properties.AbstractPage.performOk().
| void org.swtchart.Chart.renderOffscreenImage | ( | Image | image | ) |
Renders off-screen image.
- Parameters:
-
image The image to render off-screen
Definition at line 382 of file Chart.java.
| void org.swtchart.Chart.save | ( | String | filename, | |
| int | format | |||
| ) |
Saves to file with given format.
- Parameters:
-
filename the file name format the format (SWT.IMAGE_*). The supported formats depend on OS.
Definition at line 362 of file Chart.java.
Referenced by org.swtchart.ext.InteractiveChart.openSaveAsDialog().

| void org.swtchart.Chart.setBackground | ( | Color | color | ) |
Definition at line 135 of file Chart.java.
Referenced by org.swtchart.ext.internal.properties.ChartPage.apply().

| void org.swtchart.Chart.setBackgroundInPlotArea | ( | Color | color | ) |
Sets the background color in plot area.
- Parameters:
-
color the background color in plot area. If nullis given, default background color will be set.
- Exceptions:
-
IllegalArgumentException if given color is disposed
Definition at line 164 of file Chart.java.
References org.swtchart.Chart.plotArea, and org.swtchart.internal.PlotArea.setBackground().
Referenced by org.swtchart.ext.internal.properties.ChartPage.apply().


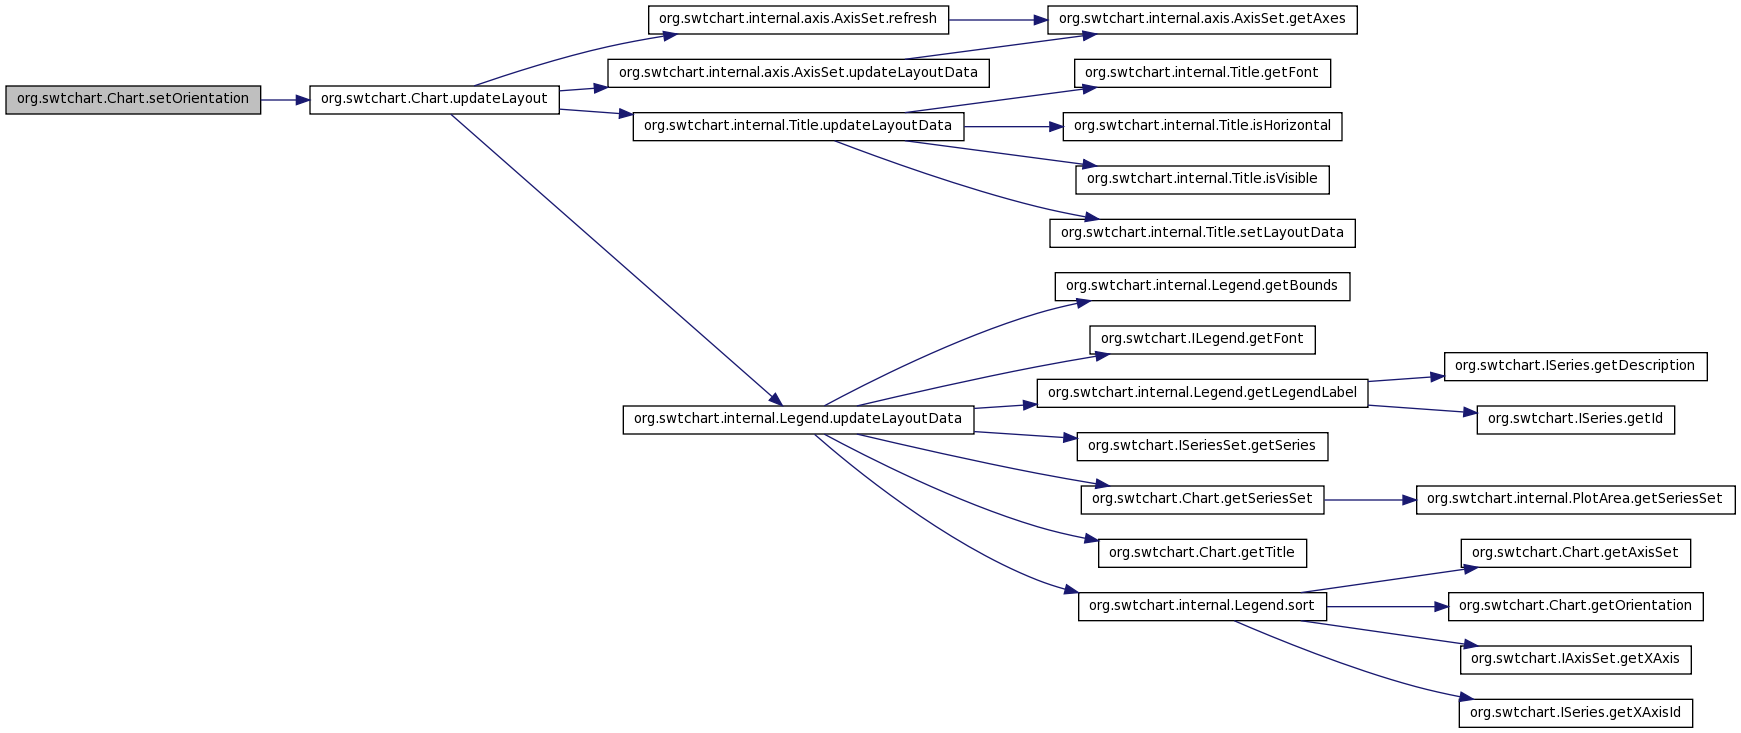
| void org.swtchart.Chart.setOrientation | ( | int | orientation | ) |
Sets the state of chart orientation.
The horizontal orientation means that X axis is horizontal as usual, while the vertical orientation means that Y axis is horizontal.
- Parameters:
-
orientation the orientation which can be SWT.HORIZONTAL or SWT.VERTICAL
Definition at line 180 of file Chart.java.
References org.swtchart.Chart.updateLayout().
Referenced by org.swtchart.ext.internal.properties.ChartPage.apply(), and org.swtchart.examples.OrientationExample.createChart().

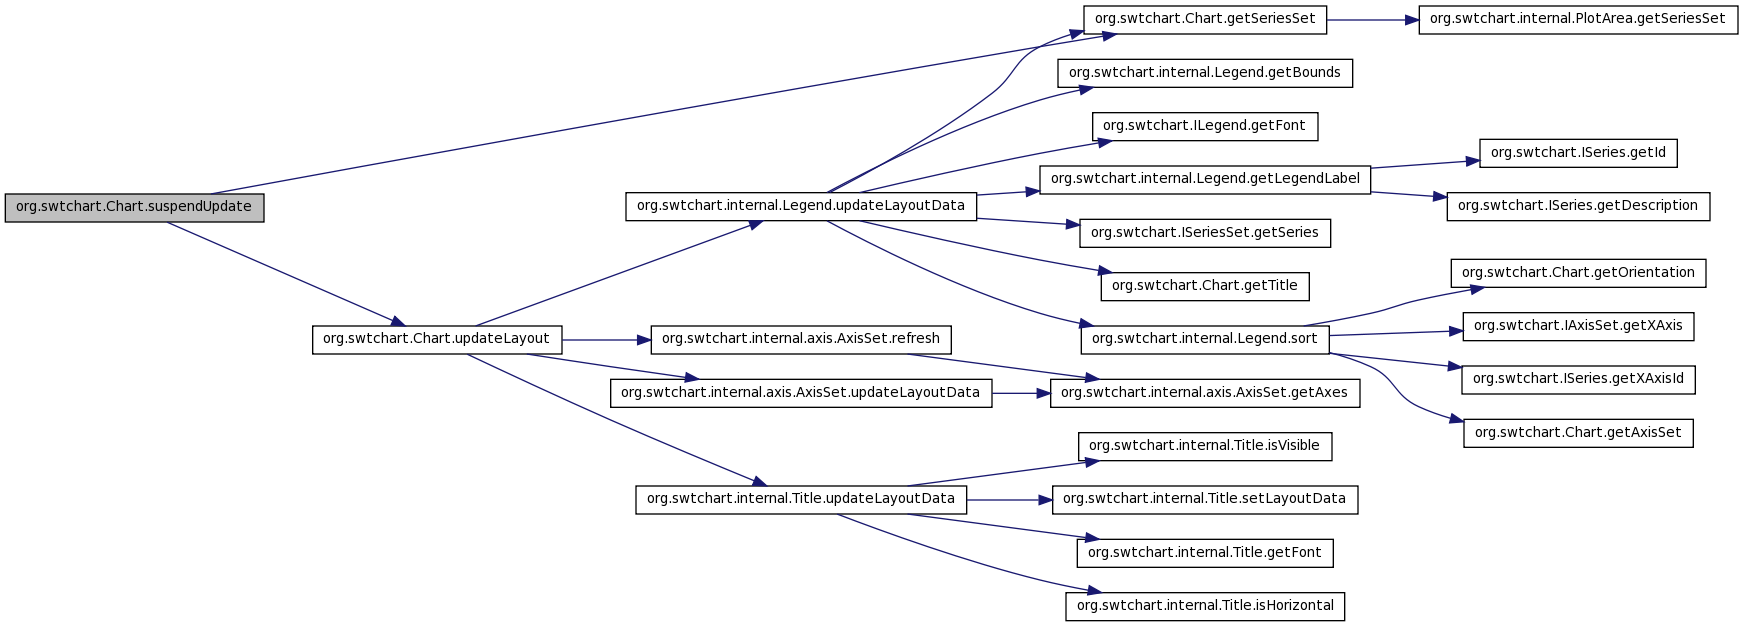
| void org.swtchart.Chart.suspendUpdate | ( | boolean | suspend | ) |
Suspends the update of chart appearance.
By default, when the chart model is changed (e.g. adding new series or changing chart properties), the chart appearance is updated accordingly.
However, when doing a lot of changes in the chart model at once, it is inefficient that the update happens many times unnecessarily. In this case, you may want to defer the update until completing whole model changes in order to have better performance.
For example, suppose there is a chart having a large number of series, the following example code disables the update during changing the model.
 try {
     // suspend update
     chart.suspendUpdate(true);
// do some changes for a large number of series
for (ISeries series : chart.getSeriesSet().getSeries()) {
series.enableStack(true);
}
} finally {
// resume update
chart.suspendUpdate(false);
}
Note that the update has to be resumed right after completing the model changes in order to avoid showing an incompletely updated chart.
- Parameters:
-
suspend true to suspend the update of chart appearance
Definition at line 257 of file Chart.java.
References org.swtchart.Chart.getSeriesSet(), org.swtchart.Chart.updateLayout(), and org.swtchart.Chart.updateSuspended.
| void org.swtchart.Chart.update | ( | ) |
Definition at line 324 of file Chart.java.
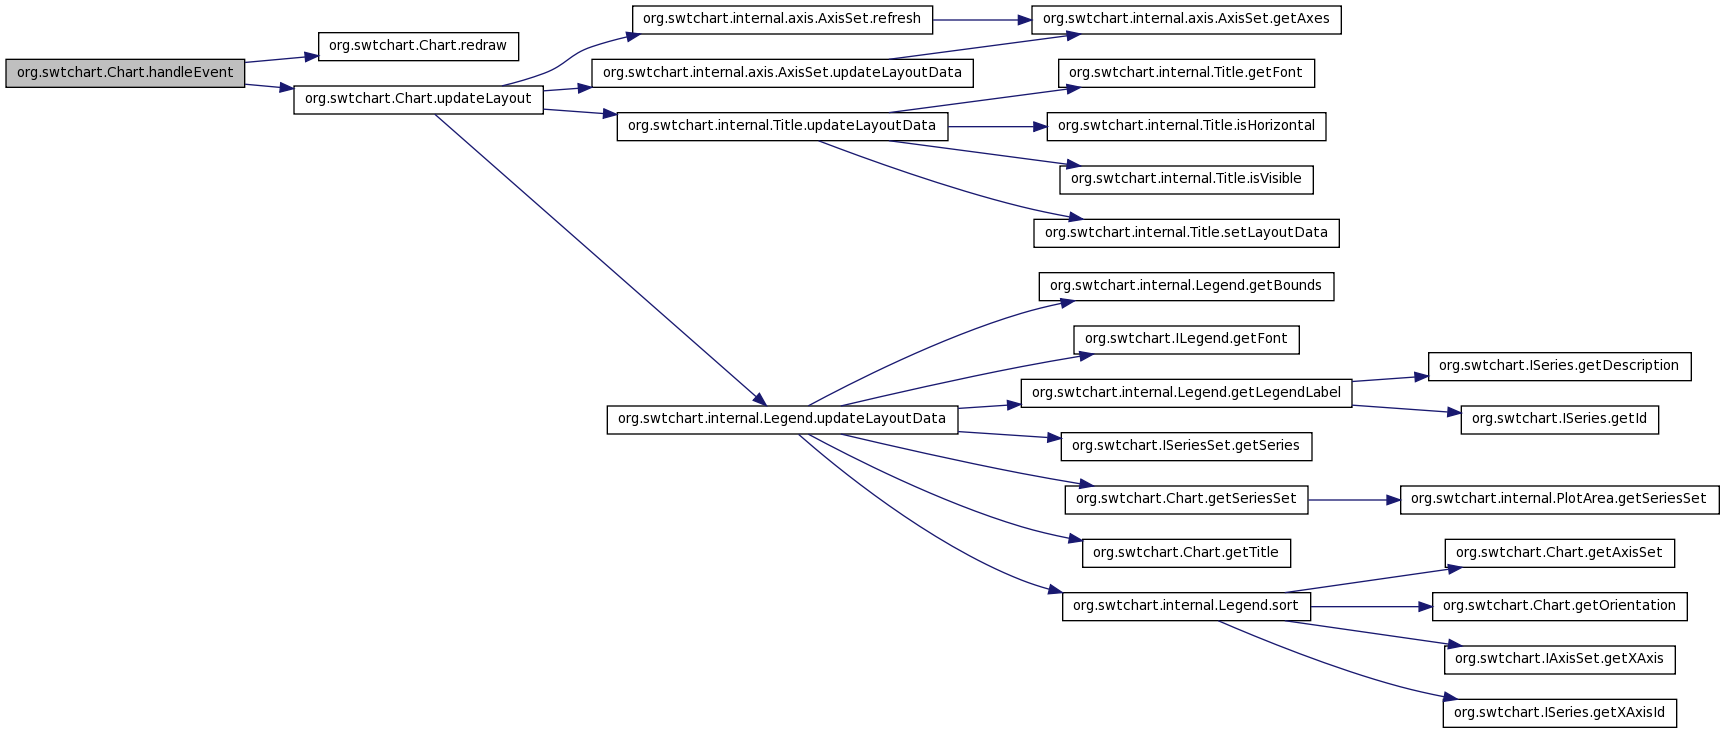
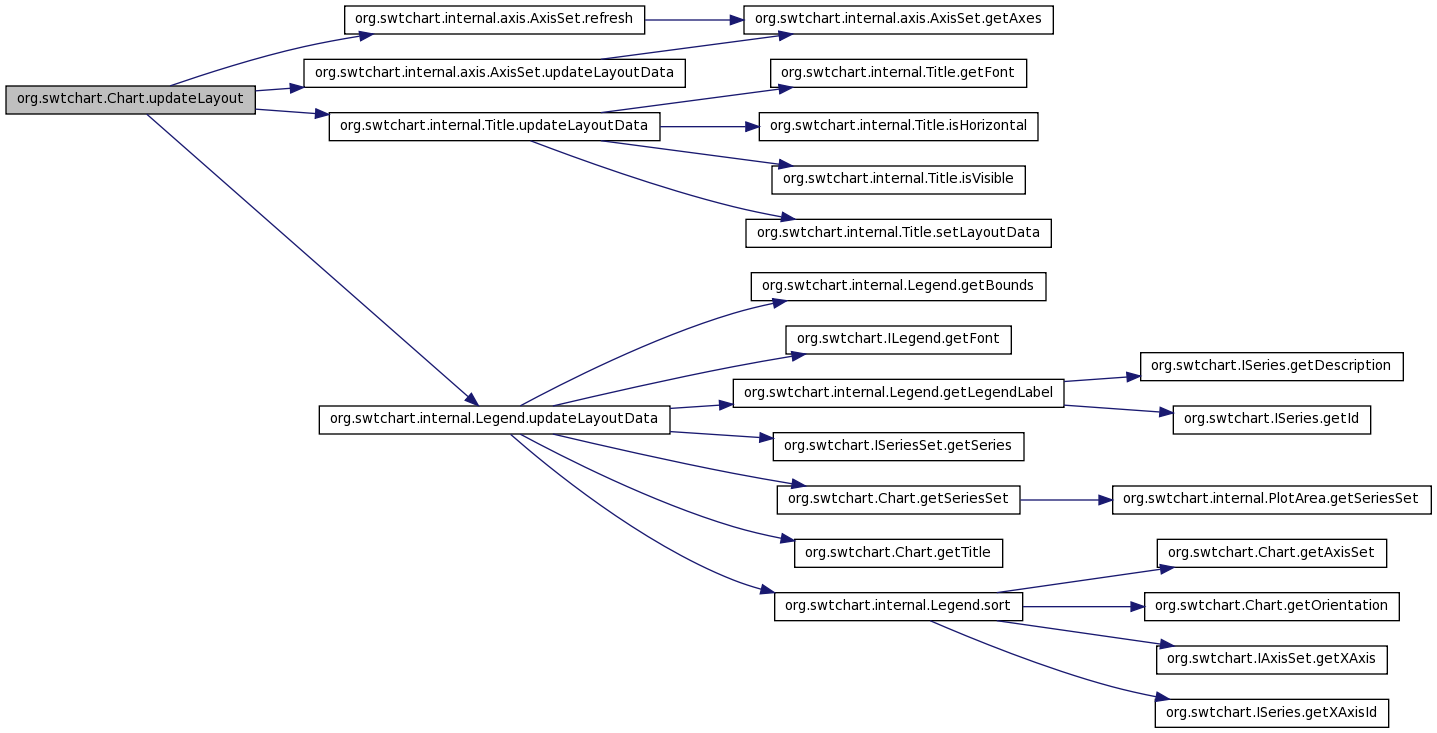
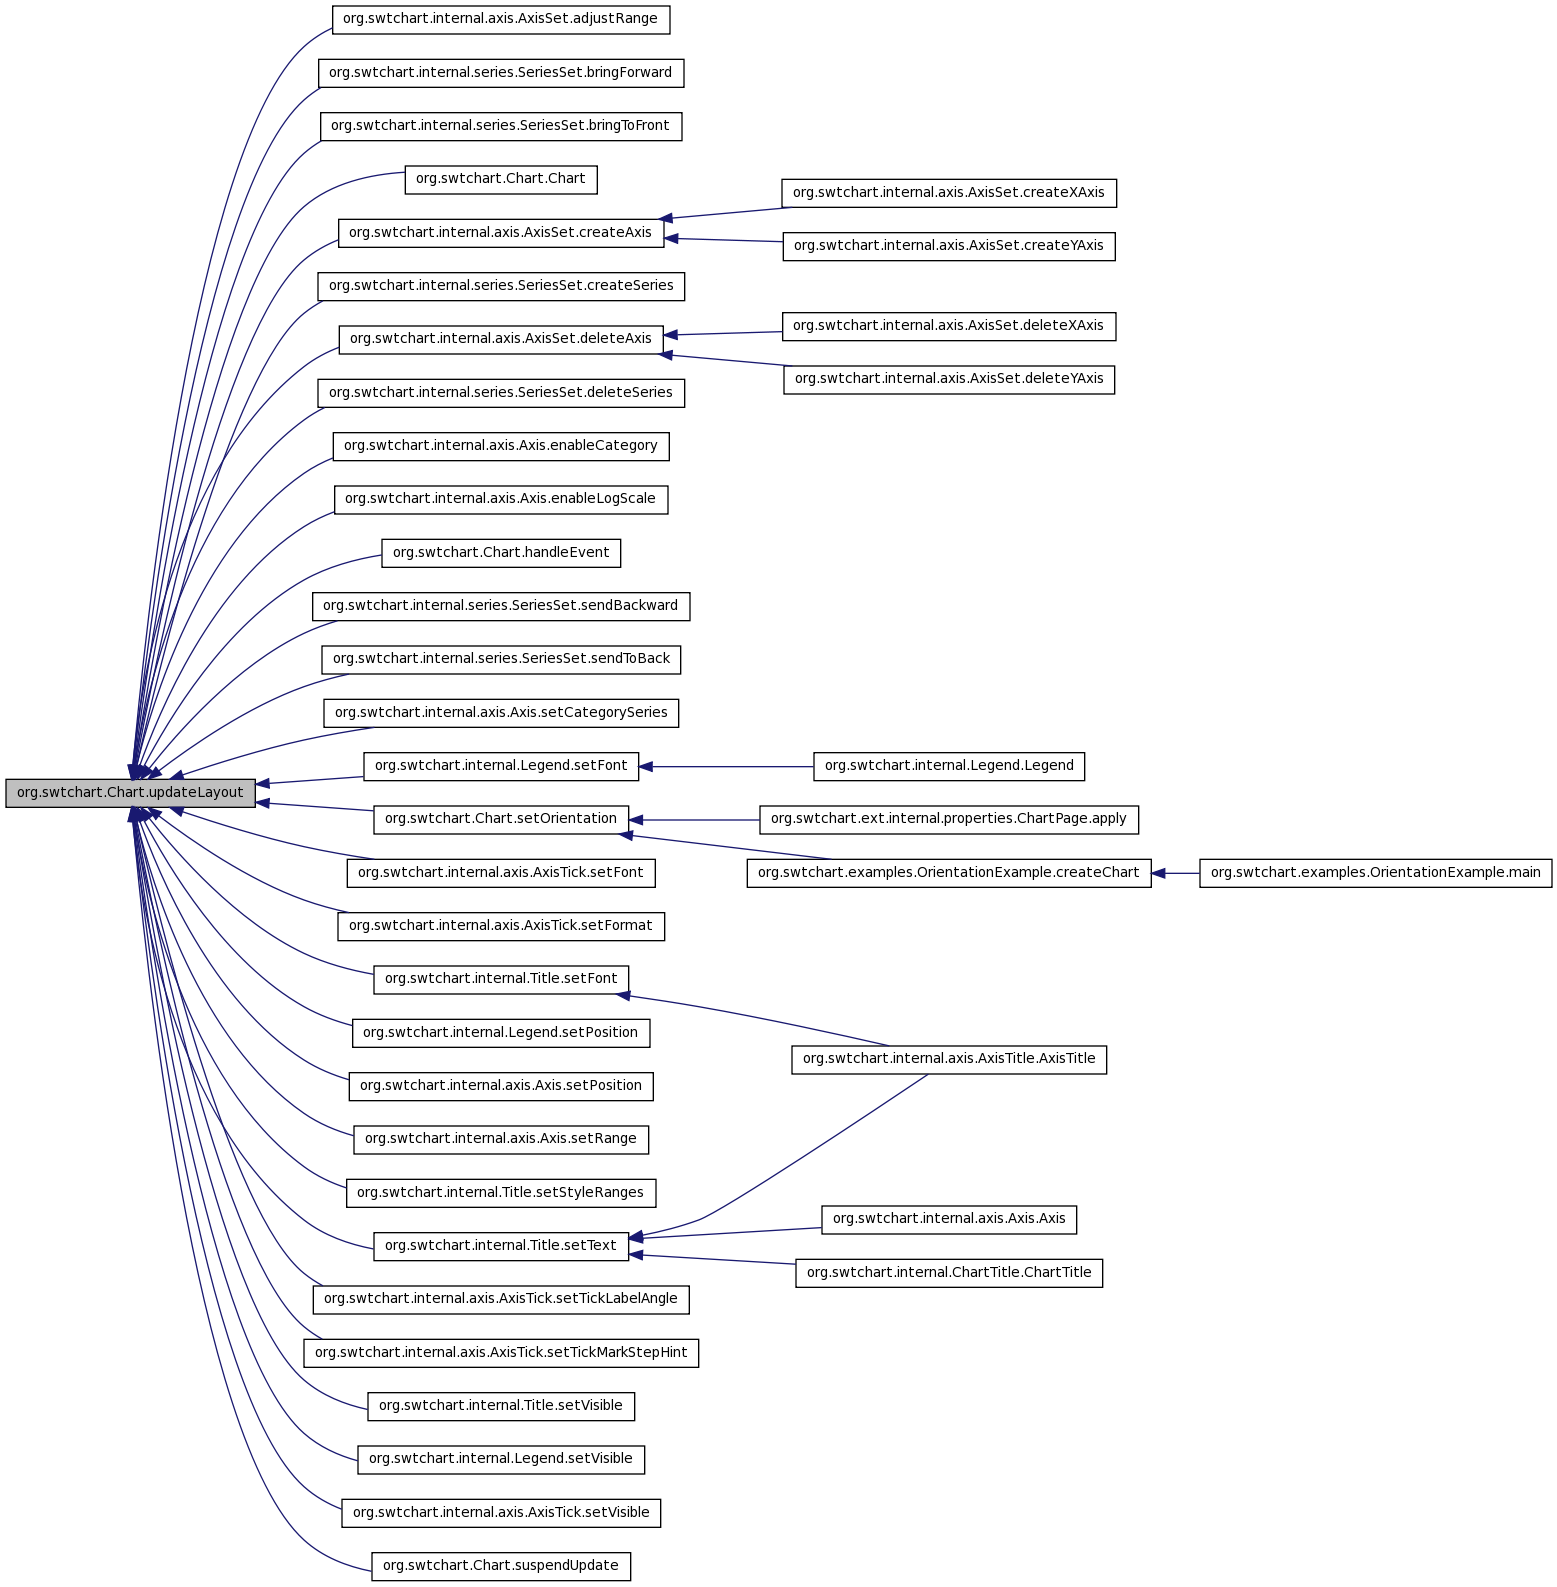
| void org.swtchart.Chart.updateLayout | ( | ) |
Updates the layout of chart elements.
Definition at line 296 of file Chart.java.
References org.swtchart.Chart.axisSet, org.swtchart.Chart.legend, org.swtchart.internal.axis.AxisSet.refresh(), org.swtchart.Chart.title, org.swtchart.internal.axis.AxisSet.updateLayoutData(), org.swtchart.internal.Title.updateLayoutData(), org.swtchart.internal.Legend.updateLayoutData(), and org.swtchart.Chart.updateSuspended.
Referenced by org.swtchart.internal.axis.AxisSet.adjustRange(), org.swtchart.internal.series.SeriesSet.bringForward(), org.swtchart.internal.series.SeriesSet.bringToFront(), org.swtchart.Chart.Chart(), org.swtchart.internal.axis.AxisSet.createAxis(), org.swtchart.internal.series.SeriesSet.createSeries(), org.swtchart.internal.axis.AxisSet.deleteAxis(), org.swtchart.internal.series.SeriesSet.deleteSeries(), org.swtchart.internal.axis.Axis.enableCategory(), org.swtchart.internal.axis.Axis.enableLogScale(), org.swtchart.Chart.handleEvent(), org.swtchart.internal.series.SeriesSet.sendBackward(), org.swtchart.internal.series.SeriesSet.sendToBack(), org.swtchart.internal.axis.Axis.setCategorySeries(), org.swtchart.internal.Title.setFont(), org.swtchart.internal.Legend.setFont(), org.swtchart.internal.axis.AxisTick.setFont(), org.swtchart.internal.axis.AxisTick.setFormat(), org.swtchart.Chart.setOrientation(), org.swtchart.internal.Legend.setPosition(), org.swtchart.internal.axis.Axis.setPosition(), org.swtchart.internal.axis.Axis.setRange(), org.swtchart.internal.Title.setStyleRanges(), org.swtchart.internal.Title.setText(), org.swtchart.internal.axis.AxisTick.setTickLabelAngle(), org.swtchart.internal.axis.AxisTick.setTickMarkStepHint(), org.swtchart.internal.Title.setVisible(), org.swtchart.internal.Legend.setVisible(), org.swtchart.internal.axis.AxisTick.setVisible(), and org.swtchart.Chart.suspendUpdate().
Member Data Documentation
AxisSet org.swtchart.Chart.axisSet [private] |
the set of axes
Definition at line 41 of file Chart.java.
Referenced by org.swtchart.Chart.Chart(), org.swtchart.Chart.dispose(), org.swtchart.Chart.getAxisSet(), and org.swtchart.Chart.updateLayout().
boolean org.swtchart.Chart.compressEnabled [private] |
the state indicating if compressing series is enabled
Definition at line 50 of file Chart.java.
Referenced by org.swtchart.Chart.Chart(), org.swtchart.Chart.enableCompress(), and org.swtchart.Chart.isCompressEnabled().
Legend org.swtchart.Chart.legend [private] |
the legend
Definition at line 38 of file Chart.java.
Referenced by org.swtchart.Chart.Chart(), org.swtchart.Chart.dispose(), org.swtchart.Chart.getLegend(), and org.swtchart.Chart.updateLayout().
int org.swtchart.Chart.orientation [private] |
the orientation of chart which can be horizontal or vertical
Definition at line 47 of file Chart.java.
Referenced by org.swtchart.Chart.Chart(), and org.swtchart.Chart.getOrientation().
PlotArea org.swtchart.Chart.plotArea [private] |
the plot area
Definition at line 44 of file Chart.java.
Referenced by org.swtchart.Chart.Chart(), org.swtchart.Chart.dispose(), org.swtchart.Chart.getBackgroundInPlotArea(), org.swtchart.Chart.getPlotArea(), org.swtchart.Chart.getSeriesSet(), and org.swtchart.Chart.setBackgroundInPlotArea().
Title org.swtchart.Chart.title [private] |
the title
Definition at line 35 of file Chart.java.
Referenced by org.swtchart.Chart.Chart(), org.swtchart.Chart.dispose(), org.swtchart.Chart.getTitle(), and org.swtchart.Chart.updateLayout().
boolean org.swtchart.Chart.updateSuspended [private] |
the state indicating if the update of chart appearance is suspended
Definition at line 53 of file Chart.java.
Referenced by org.swtchart.Chart.Chart(), org.swtchart.Chart.isUpdateSuspended(), org.swtchart.Chart.suspendUpdate(), and org.swtchart.Chart.updateLayout().
The documentation for this class was generated from the following file:
- org.swtchart/src/org/swtchart/Chart.java